Keywords
|
| Switching Overvoltage, Wind Turbine, Mitigation, DFIG, ATP. |
INTRODUCTION
|
| Wind farms are usually found in more remote places where the feeders are long and operated at a medium voltage level [1]. Isolated wind farms away from the main grids are considered weak grids because of long feeders [2]. One of the major concerns in wind farms restoration is the occurrence of the overvoltages as a result of switching procedures [3]. Wind turbine systems are subjected to many forms of transient phenomena brought about essentially by sudden changes in the steady state values of voltages or currents. Such changes may be the result of a lighting stroke, some malfunctions of the system, or be brought about by the switching of a circuit either to clear fault or as a normal operation procedure [4-6]. |
| The switching overvoltage (SOV) are has low front transient which are highly damped, and last for a short duration (few milliseconds or less) [7]. They could occur during energization and disconnection in normal operation or during a fault [8]. The magnitude and shape of the SOVs vary with the system parameters and network configuration. Even with the same system parameters and network configuration, the SOVs are highly dependent on the characteristics of the circuit breaker operation and the point-on-wave where the switching operation takes place [3]. |
| The severity of energization SOV depends on the difference between the supply and the transmission system voltages at the instant of energization [9]. When a transmission system is energized SOV are generated not only on the transmission system but also in the supply network [10]. Pre-insertion resistor (PIR), controlled switching of circuit breaker, shunt reactor, and surge arresters are used as protective devices to mitigate energization overvoltages. |
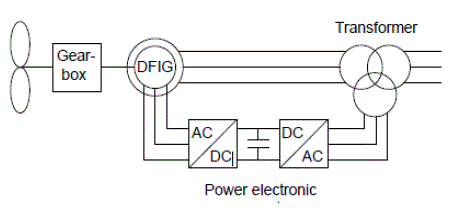
| The use of doubly-fed induction generator (DFIG) is receiving an increased attention for wind generation purposes [9, 11]. DFIG is basically a standard, wound rotor induction machine with its stator windings directly connected to the grid and its rotor windings connected to the grid by electronic converters through slip rings, as shown in Fig. 1 [12]. |
| DFIG is one of the most commonly used technologies nowadays, as these offer advantages such as the decoupled control of active and reactive powers and maximum power tracking. These capabilities are possible due to the power electronic converters used in this type of generator [13]. |
| In this paper, the mitigation of SOVs, which are generated due to energization procedures in grid-connected off-shore wind farms, are evaluated. PIR, controlled switching of circuit breaker, shunt reactor, and surge arresters are used as protective devices to mitigate energization SOVs. Alternating Transient Program (ATP) is used in this study for simulating the test power system and the SOV mitigation methods [14]. |
II. THE INVESTIGATED OFFSHORE WIND FARM
|
| A. Description of the Wind Farm |
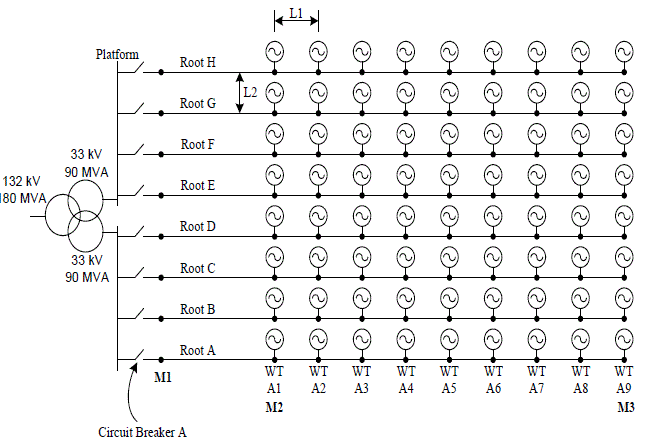
| The investigated wind farm consists of 72 wind turbines (WTs) with a rated power of 2.3 MW. The turbines are arranged in a parallelogram, formed by eight rows with nine WTs each, as shown in Fig. 2 [15, 16]. The WTs are connected in rows by means of 33 kV submarine cables. Each row is then connected to the platform by one root cable. The park transformer (132/33/33 kV) is in the central position. Each feeder is connected by a vacuum circuit breaker, followed by the root cable. There are eight rows, from A to H, where A, B, C and D are connected to one medium voltage (MV) winding, and E, F, G, and H to the other MV winding [15]. |
| The submarine cable is connected on the bottom of each WT where the armor and the shield are grounded. Then the transformer (2.5 MVA, 33/0.69 kV) is connected via switch disconnector-fuse on the MV. The WTs are interconnected through 36 kV cables of 505 m of length. Furthermore, the high voltage (HV) grid (132 kV), sea cable (10.5 km) and land cable (18.3 km) are included in the models [16]. |
| B. Modeling of the Wind Farm |
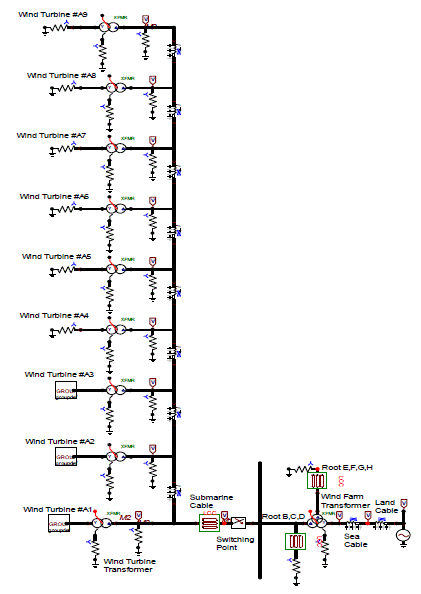
| ATP is used for modeling the components of the investigated offshore wind farm as illustrated in this section. Fig. 3 shows the ATP model of the investigated offshore wind farm. In this model, it is shown that: |
| 1. The grid is modeled as a voltage source. |
| 2. The HV, 132 kV, three-phase single-core sea and land cables are modeled as symmetrical, distributed parameter and lumped resistance models. |
| 3. The wind farm transformers are modeled using HYBRID transformer model [14]. |
| 4. The rows B, C, and D are modeled as one three-phase single-core cable because they are connected in parallel. Also, the rows E, F, G, and H are modeled in the same way. |
| 5. Only row A is modeled in details. |
| Fig. 3 shows the nine identical wind turbine transformers (WTTs) in row A. To reduce the simulation time, the complexity of the wind farm model is reduced by equivalent models. The WTGs in the wind farm are aggregated into a three separate equivalent model and the rest of the turbines in row A are modeled as very light loads connected on the LV side of the WTTs. The light load is modeled as a high resistance of 1200 Ω. Therefore, the nine WTTs of row A are considered as transformers under no-load. WTGs are considered as operating on an equivalent internal electrical network provided that the incoming wind velocity is identical or similar on all the WTs [16]. |
| C. Modeling of Cables and Transformers |
| The MV single-core submarine cables are the most distinctive electric component in the off-shore wind farms. The 33 kV three-phase single-core submarine cables connect between the HV sides of the WTTs. The geometric configuration of the submarine cables which is calculated based on the power transferred through them [16], and the cable calculated parameters are given in Table 1. |
| In submarine cables, the armor is usually quite thick. Therefore, it is assumed in this study that, an armor of 5 mm steel wires thickness and a 5 mm outer insulation thickness are incorporated into the three-phase single-core submarine cable design. So, the overall outer diameter of the medium voltage single-core submarine cable is 65 mm. The MV (33 kV) single-core submarine cables are modeled using the frequency dependent LCC model [14]. This model represents the frequency dependence of single-core submarine cable parameters, so this model is much recommended for the electromagnetic transient studies [14]. |
| The sea and land cables are modeled using the three phase Clark model [14] to avoid the numerical errors due to the long length of the HV cables. The model parameters are calculated from the cable dimensions and its materials using distributed parameters of three phase transposed model at 50 Hz. Both dimensions and materials of the HV sea and land cables are taken from [17]. Table 2 gives the positive and the zero sequence resistances, the inductive reactance and the capacitive reactance of the 132 kV land and sea cables, respectively. |
| Both wind farm transformers and off-shore wind farm transformer are modeled using the HYBIRD transformer model. The wind turbine transformers of row A are modeled using three phase, two windings, HYBIRD model. The wind farm transformer is modeled as three winding transformer using the HYBIRD model, which is suitable for low and medium frequency transient studies [18, 19]. Table 3 gives the data required for transformers modeling. |
| D. Modeling of DFIG-based Wind Turbine |
| A complete wind turbine model is used in this study [20]. The model includes the wind speed model, the aerodynamic model of the wind turbine, the mechanical model of the transmission system and models of the electrical components. The induction generator, PWM (Pulse Width Modulated) voltage source converters, transformers, and the control and supervisory system are modeled in details [20]. |
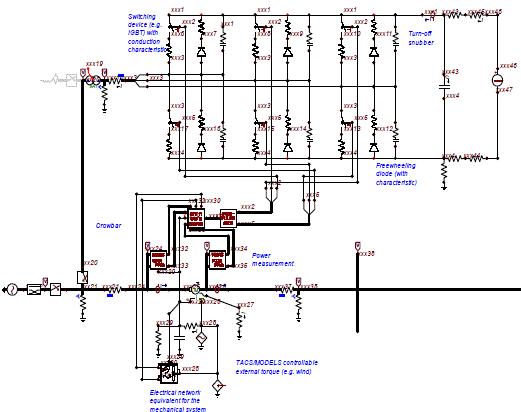
| Fig. 4 illustrates the DFIG-based wind turbine model in ATP [20]. This model is used for accurate simulation of the DFIG-based wind farm. Also, Table 4 summarizes the data used to parameterize the DFIG. |
III. SWITCHING OVERVOLTAGE MITIGATION METHODS
|
| A- The Mitigation Methods |
| Traditionally, SOV is limited through the adoption of PIR in the line circuit breakers. Another method to reduce SOV is the synchronous switching of circuit breakers. The installation of shunt reactors is also used to mitigate SOV. Furthermore, the surge arresters are used to limit SOV in power systems. ATP is used for modeling of the investigated SOV mitigation methods. |
| Pre-Insertion Resistor (PIR): The closing resistors are inserted in series with the cable, normally being short circuited after 10 ms, thereby damping the switching overvoltage[21]. In the present case, an actual 500 Ω resistor, with an insertion time equals the switching time, is installed. |
| Synchronized Circuit Breakers: By means of synchronized switching controllers, both energizing and de-energizing operations can be controlled with regard to the point-on-wave position to mitigate harmful transients [22]. The suitable making instant for controlled switching is the time in which the voltage across the circuit breaker contacts for each phase is zero and the predicted time span between the closing instant of the first and the last pole is as small as possible [23]. In this study, the closing order is given when the voltage of each phase crosses consecutives zero. |
| Shunt Reactor: Shunt reactor is proposed to damp the overvoltages and to keep the system voltage within the permissible limits [24]. Reactors are modeled in many studies by a simple lumped inductor with a series resistance. A parallel resistance may be added for realistic high frequency damping [25]. A shunt reactor is added nearby the switching point. |
| Surge Arrester: Surge arrester provides a temporal path to earth which the superfluous charge is removed from the system [26]. With the information of volt-ampere characteristic of surge arrester, equivalent model of surge arrester is presented in [27]. This model is used in this study. |
| B- Results and Discussion |
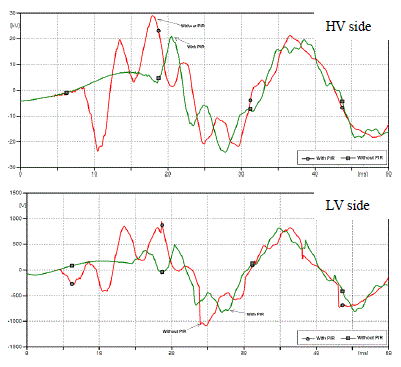
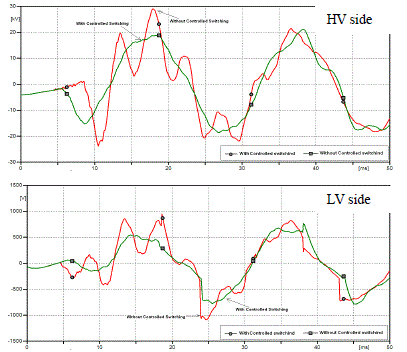
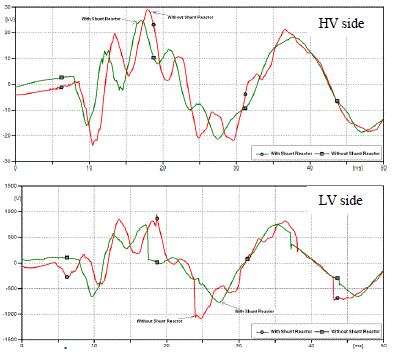
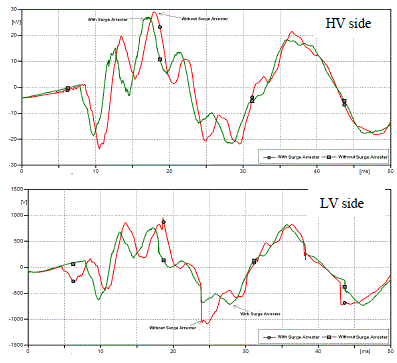
| The switching overvoltages, which are generated in wind turbine systems due to switching operations during energization procedures, are evaluated. The investigation of SOV mitigation is studied due to the energization of row A. This is carried out by closing the three phases of the circuit breaker at the platform of row A. The switching is applied at the voltage peak by closing the circuit breaker phases when the voltage of each phase crosses consecutives 90o. The voltage waveforms caused by the switching are investigated on both the HV side (33.0 kV) and the LV side (0.69 kV) of the wind turbine transformers of row A. Figs. 4 to 7 show the maximum SOV at both the HV side and the LV side of the first wind turbine transformer with and without using PIR, controlled switching of circuit breaker, shunt reactor, or surge arresters, respectively. |
| Due to using the PIR, the SOV at the HV side of the wind turbine transformers of row A is reduced from 1.526 pu (29.08 kV) to 1.108 pu (21.1 kV) and from 1.576 pu (1.087 kV) to 1.1965 pu (0.826 kV) at the LV side, as shown in Fig. 4. Fig. 5 illustrates the SOV due to using controlled switching of the circuit breaker at the HV side of the wind turbine transformers of row A which is reduced from 1.5266 pu (29.08 kV) to 0.9929 pu (18.915 kV) and from 1.576 pu (1.087 kV) to 1.124 pu (0.7758 kV) at the LV side. |
| Using the shunt reactor reduces the SOV at the HV side of the wind turbine transformers of row A from 1.5266 pu (29.08 kV) to 1.305 pu (24.859 kV) and at the LV side is reduced from 1.576 pu (1.087 kV) to 1.3047 pu (0.9 kV), as shown in Fig. 6. Using the surge arrester reduces the SOV at the HV side of the wind turbine transformers of row A from 1.5266 pu (29.08 kV) to 1.422 pu (27.087 kV) and at the LV side from 1.576 pu (1.087 kV) to 1.126 pu (0.777 kV), as shown in Fig. 7. |
| It can be seen that the PIR and the controlled switching of circuit breaker present an accepted remarkable performance. They reduce the overvoltages to acceptable values (arround 1.0 pu). |
IV. CONCLUSION
|
| In this paper the mitigation of energization switching overvoltages in weak grid-connected wind farms is investigated. The DFIG-based wind turbine model in ATP is used for the simulation of the wind farm. A wind farm which consists of 72 wind turbines is used for this analysis. The pre-insertion resistor, controlled switching of circuit breaker, shunt reactor, and surge arresters are chosen as protective devices to mitigate the switching overvoltages. |
| The results show that the switching overvoltages decrease as the PIR or controlled switching of the circuit breaker is used. The shunt reactor and the surge arrestor can’t mitigate the switching overvoltages to the accepted levels. The superior the switching overvoltages in the grid-connected offshore wind farm encourages the authors for more investigations on its effects on the DFIG performance. |
Tables at a glance
|
 |
 |
 |
 |
| Table 1 |
Table 2 |
Table 3 |
Table 4 |
|
Figures at a glance
|
 |
 |
 |
 |
| Figure 1 |
Figure 2 |
Figure 3 |
Figure 4 |
 |
 |
 |
 |
| Figure 5 |
Figure 6 |
Figure 7 |
Figure 8 |
|
| |
References
|
- Bindner, H., “Power Control for Wind Turbines in Weak Grids: Concepts Development”, Risø National Laboratory, Roskilde, March 1999.
- M. Rashed, S. Abulanwar, F. M. H. Youssef, “H8 Robust Controller for a Long VSC-HVDC Link Connected to a Weak Grid”, MansouraEngineering Journal, Vol. 35, No.1, PP.E.53-E.60, March 2010.
- Thukaram, D., Khincha, H. P. and Khandelwa, S., “Estimation of Switching Transient Peak OvervoltagesDuring Transmission LineEnergization using Artificial Neural Network”, Electric Power Systems Research, Vol. 76, pp. 259–269, 2006.
- Janik, P., Lobos, T. and Rezmer, J., “Assessment of Transients in Power System with Wind Generators by Application of Prony Method”,19th International Conference on Electricity Distribution, CERID, Vienna, 21-24, Paper No 0225, May 2007.
- Intermediate Energy Infobook, ”Wind Energy”, www.NEED.org, 2012.
- Bickford, J. P. and Heaton, A. G., ”Transient Overvoltage on Power Systems”, IEE Proceedings, Vol.133, Pt.C, No.4, May 1986.
- GIGRE Working Group, “Switching Overvoltage in EHV and UHV Systems with Special Reference to Closing and Reclosing TransmissionLines”, Electra, Vol. 30, pp. 70-122, 1973.
- King, R., Moore, F., Jenkins, N., Haddad, A., Griffiths, H. and Osborne, M., “Switching Transients in Offshore Wind Farms – Impact on theOffshore and Onshore Networks”, IPST, Delft, the Netherlands, June 14-17, 2011.
- Zobaa, A. F., “Technology of VAR Compensators for Induction Generator Application in Wind Energy Conversion Systems”, Journal ofElectrical Systems, Vol.2, No.3, pp.172-184, 2006.
- Pasand, M., Dadashzadeh, M. and Khodayar, M., “Limitation of Transmission Line Switching Overvoltages using Switchsync Relays”, IPST,Montreal, Canada, June 19-23, Paper No.087, 2005.
- Tapia, A., Tapia, G., Ostolaza, J. X. and Sáenz, J. R., “Modeling and Control of a Wind Turbine Driven Doubly Fed Induction Generator”,IEEE Transactions On Energy Conversion, Vol. 18, No. 2, June 2003.
- Babypriya, B. and Anita, R., “Modeling, Simulation and Analysis of Doubly Fed Induction Generator for Wind Turbines”, Journal ofElectrical Engineering, Vol. 60, No. 2, pp.79–85, 2009.
- Muñoz, J. C., “Comparative Stability Analysis of DFIG-based Wind Farms and Conventional Synchronous Generators”, ece.uwaterloo.ca.
- Prikler, L. and Høidalen, H. K., ”ATPDRAW version 5.6 Users' Manual”.
- Arana, I., Holbøll, J., Sørensen, T., Nielsen, A. H., Sørensen, P. and Holmstrøm, O., "Comparison of Measured Transient Overvoltages in theCollection Grid of Nysted Offshore Wind Farm with EMT Simulations", IPST, Kyoto, Japan, June 3-6, 2009.
- Badran, E. A., Rizk, M. E. M. and Abdel-Rahman, M. H., “Investigation of Submarine Cable Parameters Impact on EnergizationTransientsin Offshore Wind Farms”, IPST, Delft, The Netherlands, June 14-17, Paper No. 182, 2011.
- “ABB XLPE Cables User’s Guide”, Technical documentation, www.abb.com.
- Chiesa, N. and Høidalen, H. K., ”Hysteretic iron-core inductor for transformer inrush current modeling in EMTP”, 16th Power SystemsComputation Conference, PSCC08, Glasgow, Scotland, Jul. 2008.
- Hassan, E. O., Badran, E. A. and Youssef, F. M. H., "A Comparison Between Some Currently Used High Frequency Transformer Models",Mansoura Engineering Journal, Vol. 39, No. 1, pp. E1-E7, March 2013.
- La Seta, P. , “Modeling and Control of Wind Turbines Based on Doubly-Fed Induction Generators (DFIG)”, EEUG Meeting, 2009.
- Soloot, A. H., Gholami, A., Agheb, E., Shorbendaeipour, A. and Molchtari, P., "Investigation of Transmission line Over Voltages and TheirDeduction Approach", Word Academt of Science Engineering and Technology, Vol. 53, pp. 18-26, 2009.
- Sanaye-Pasand, M., Dadashzadeh, M. R. and Khodayar, M., “Limitation of Transmission Line Switching Overvoltages using SwitchsyncRelays”, IPST, Montreal, Canada, June 19-23, Paper No. IPST05 – 087, 2005.
- Dantas, K. M. C., Neves, W. L. A., Fernandes, D., Cardoso, G. A. and Fonseca, L. C., “On Applying Controlled Switching to TransmissionLines: Case Studies”, IPST2009, Kyoto, Japan, June 3-6, 2009.
- Elkhodary, S. M. and Abdel-Munem, A. S., “New Proposed Method of Damping Temporary Overvoltages on Power SystemInterconnections”, Journal of American Science, Vol. 6, No. 11, pp. 336-342, 2010.
- The Switching Transients Task Force of the IEEE Modeling and Analysis of System Transients Working Group, “Modeling Guidelines forSwitching Transients”, www.ee.umanitoba.ca.
- Xue, H., ”Analysis of Switching Transient Overvoltage in the Power System of Floating Production Storage and Offloading Vessel”, M.Sc.Thesis, Delft University of Technology.
- Bayadi, A., Harid, N., Zehar, K. and Belkhiat, S., ”Simulation of Metal Oxide Surge Arrester Dynamic Behavior Under Fast Transients”,IPST, New Orleans, USA, 2003.
|