ISSN: 2319-9873
ISSN: 2319-9873
Biya Motto Frederic*
Department of Physics, Faculty of Sciences, University of Yaoundé I, P O Box 812, Cameroon
Received: 17 May 2014 Accepted: 26 June 2014
Visit for more related articles at Research & Reviews: Journal of Engineering and Technology
The article talks about the models, algorithms and Maple codes for risks minimising of multimodal transport
models, algorithm, risks, multimodal transport
For transport sector in general and for waterways in particular; almost all the technological processes (exploitation of transport objects, loading of goods and passengers, etc) depend on the influence of random factors [1-4]. The result of their action can be sometimes the loss of very important material resources. For minimisation of losses, we can use the method for risk theory.
In the ISO Guide 73 – 2009, risk is defined as “effect of influence by non-determination on achievement for intended objectives” [5]. Influence effect is understood as deviation of expected result that is deterioration of a certain critical indicator.
We can consider as critical indicator, any quality indicator such as profit or the activity of a given transport firm (seaport, navigation company or transport logistic complex). We can consider that various risk factors acting on criterial indicator are affecting it.
Risk factors can be classified into different categories: risks for various transport sectors and risks for goods transportation. Inside those categories we can classify incidents on a given transport sector from action of random factors (climate, seismic conditions, human factors, etc).
During occurrence, risks situations losses can be noted (deterioration of indicator) equal to Z. From the stochastic nature of risks, losses objective indicators, which are functions for random values of risks: Z = f (Z1, Z2, - -, Zn) also have probabilistic characters.
Z1, Z2, - -, Zn – possible medium loss of criterial indicator due to various factors of risk. Very often; functional dependence for the criterial indicator is a linear composition.
Z = Z1 + Z2 + - - - + Zn.
As a model for evaluation of Z, we can use its distribution function of probability occurrence.
For that purpose, it is important to know the integral distribution functions of probabilities for risk factors.
If we assume that random value Z has finite mathematical expectation equal to μ, then we can declare considering a probability γ that possible losses of critical indicator will belong to the interval [μ - δ; μ + δ].
Unknown value δ is root of equation
F(μ + δ) – F(μ - δ) = γ; where
F(x) – integral distribution function of possibilities for indicator Z.
Calculation of F(x) is usually a difficult task because we first need to know the distribution function of probabilities for risk factors whose definition is sometimes impossible.
Another complex situation is due to the fact that some risk factors are continuous random values while others are discrete. Instead of looking for F(x), we can define the mathematical expectation of random value Z.
Quantitative evaluation of ith risk factor influence Zi is expressed by medium value of losses for criterial indicator with realization of that risk:
Zi = piΔZi ; where pi is occurrence probability of ith risk factor and ΔZi is absolute losses when it is realized.
If the ith risk can appear depending on one of mi independent events Aij with probability pij, then the quantitative evaluation of level of risk is expressed from the relation:
 (1)
(1)
Where pij = p({Zi = ΔZi}/Aij) – probability of diminution of criterial indicator by ΔZij, with condition for appearance of event Aij.
In general, the evaluation of diminution for criterial indicator can be expressed as the sum of possible medium losses because of each n-risk:
 (2)
(2)
Simultaneous occurrence of all possible risk situations is an event with very low probability. We often obtain a chain of mutually related risks.
To define among them the one that has maximal possible value of losses for criterial indicator, we can use the construction of acyclic oriented graph of risk situations.
Let us consider G = (V, E) – acyclic oriented graph, where
V = {1, 2, 3, …., n} – the set of summits of the graph,
E = {(i, j)} – the set of arcs
The arc (i, j) starts from summit i to summit j belongs to graph G if the risk situation j can happen because of risk situation i. The length of that arc or its weight coefficient Zi corresponds to possible value of losses for criterial indicator when risk situation i is realized.
In the acyclic graph we can number the summits so that for all arcs (i,j) we could satisfy the condition i>j. To simplify the mathematical model, we introduce a fictive summit n. we add arcs from summit n to summits where no arc is included. We consider that those arcs have weight coefficients equal to zero.
To get the most critical chain of risk situations, considering [6], we represent a given chain by the vector:
 (3)
(3)
With xij = 1, if arc (i,j) belongs to the chain and xij = 0 if not
Vector X = {xij/(i,j) εG} describes the chain that passes through summits of graph G, if the following conditions are satisfied:
 if iε{2, 3, …., n-1} (4)
 (5)
(5)
 (6)
(6)
The possible value of losses of criterial indicator for the chain of risk situations can be obtained from the relation;

Where Zij = zi if arc (i,j) belongs to the graph G, if not then zij = 0
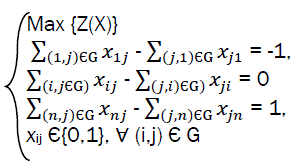
To get the critical chain of risk situations we suggest the following model;
 iÃÂÃâ{2, 3, …., n-1}, (8)
For great dimensions of adjacent matrix of graph G, there are fast and effective algorithms of obtaining chains with maximal length. Using he condition of non-negativity of weight coefficients of graph G, we can use the algorithm of Deukstra [7].
The quantity of possible risk situations is often very little, that is why the dimension of adjacent matrix of graph G permits to use algorithm of total surplus for all possible chains. We thus use mathematical package of analytical Maples calculations where we have GraphTheory with various tools of representation of graphs. Maple also includes developed medium of programming with interesting tools of graphs construction [8,9].
As mentioned, for acyclic oriented graph, we can obtain a linear ordered series of summits such that initial summit of any arc of graph is positioned before the final summit of arc. This means that we can represent all the summits of the graph in the form V1, V2, ….., Vn and summit Vi comes before Vj (i<j), if we have arc (Vi,Vj) on the graph. This helps us to reduce the time complexity of algorithms for determination of critical chain of risk situations.
Algorithm code realized in Maple package is partially represented as follows:
>restart: with (GraphTheory):
> # create list of adjacent summits from adjacent matrix
AdjRep: proc (am)
end proc:
># determine weights of the chain
weightS: = proc (p, wm)
end proc:
># create all possible chains from summit v
InDepth: =proc (v) # summit number for construction of local i, j, k; global adjG, AllS, P;
end proc,
> # find all possible critical chains
AllCriticalR:=procG # G – graphical structure
local i,j,n,vSort,w,am,wm,wNom;
global PrintV,AdjRep,InDepth,weightS,adjG,AllS,p;
wm:=weightMatrix(G);
am:=AdjacencyMatrix(G);
adjG=AdjRep(am);
vSort:=TopologicSort(G);
AllS:=[ ]
P:=[ ]:
InDepth(vSort[1]);
w:=weightS(AllS[1],wm):
wNom:=[1]:
for i from 2 to nops(AllS) do
n:=weightS(AllS[i],wm):
if n>w then
wNom:=[i]:
w:=n:
elif n=w then
wNom:=[op(wNom),i]:
end if
end do:
for i from 1 to nops(wNom) do
PrintV(AllS[wNom[i]],w)
end do:
end proc:
>adjG:=[]:
AllS:=[ ]:
P:=[]:
AllCriticalR(G);
In real conditions losses can have random values from a certain interval or discrete diapason. To consider the stochastic character of losses of criterial indicator, we will use Zij in (eq7) as random value, with distribution density of probabilities for continuous random value Pzij(z) or dependent relation of distribution of probabilities for discrete random value:
{Zijk->Pijk=P(Zij =Zijk)},k=1,2,....n
To the constraints of model (eq8) we add another limitation
 (9)
(9)
Where α is the given level of signification

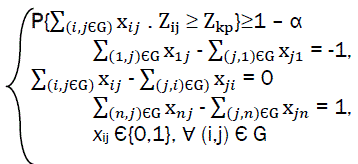
max {Zkp },
In model (eq10) with continuous conditions of random value of chain length, the maximum is reached for equality in constraint of (eq9).
For analysis and control of risk situations;, apart from the revealing of critical chains for risk situations, we can suggest determination of chains stochastic model for which probability of having losses for criterial indicator will be significant and will be above the given level α.
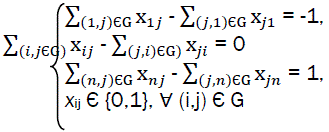
Such a model will be constructed for the criteria:
 (11)
(11)
with constraints
 (12)
(12)
For models (eq10) – (eq12), we can use modified “random research method” [3,10-12].
Models, algorithms and software meant for them can be successfully used in other areas and applications after very little modifications [13,14].