ISSN ONLINE(2319-8753)PRINT(2347-6710)
ISSN ONLINE(2319-8753)PRINT(2347-6710)
N.Kartheeswari1, K.Viswanathan2
|
| Related article at Pubmed, Scholar Google |
Visit for more related articles at International Journal of Innovative Research in Science, Engineering and Technology
TGS crystals are important ferroelectric materials. TGS plays a vital role in Infrared detector and FT-IR instrumentation and most widely used in Capacitors, RAM, Earth exploration monitoring, Pyroelectric vidicon tubes etc. In present work TGS, TGSP and TGSZC crystals are grown by slow evaporation method and then the grown crystals are subjected to UV, IR and Raman spectral studies. From UV – Vis spectral study optical transparency of the grown crystals is determined. From FT-IR and Raman spectral studies the presence of characteristic functional groups are confirmed. Powder XRD study is carried out to determine the crystal structure of grown crystals. Ferroelectric hysteresis study is carried out using homemade Sawyer-Tower circuit to investigate the ferroelectric behavior of grown crystals. Spontaneous polarization values were obtained. Electrical conductivity measurements are carried out for grown crystals. NLO property of grown crystals is tested using Kurtz-Perry powder technique.
Keywords |
| Growth from solution, ferroelectric materials, Characterization, Zwitter ion, glycinium ion. |
INTRODUCTION |
| Triglycine sulfate is a good ferroelectric material for fabrication of Infrared detector. TGS has attractive pyroelectric coefficient and dielectric constant values at room temperature. It exhibits second order phase transition at the Curie point 490C. It provides large spontaneous electric polarization below its Curie point. It has basic pyroelectric figure of merit P/K = 1.1x 10⁻⁵ C/m2K[1]. The crystal structure of TGS was reported by Hoshino et al [2]. The unit cell of TGS contains three types of glycines GI, GII, and GIII. Glycine I is in the form of Zwitter ion. GII and GIII are two planar glycines. They have protonated Carboxyl groups which have taken protons from the sulfuric acid. They form chain like system with SO4 2- group. They have protonated Carboxyl groups which have taken protons from the sulfuric acid. They form chain like system with SO4 2- group. The neighbouring chains are connected by SO4 2- groups of adjacent chains and GI group. Such configuration of TGS is regarded as particularly important for the ferroelectric behavior of TGS crystal. The orientation of positively charged NH3 groups determines the direction of spontaneous polarization in TGS. The spontaneous polarization reversal in TGS is due to the proton transfer between glycine and glycinium ions [3]. TGS exhibits order-disorder phase transition at the Curie point. Above Curie temperature it is in para electric phase with space group symmetry P21 /m and below Curie it is in ferroelectric phase with space group symmetry P21 with two formula units per unit cell[4]. The unit cell parameters of TGS are a = 9.15AÃâ¹ÃÅ¡, b = 12.6445AÃâ¹ÃÅ¡, c = 5.725AÃâ¹ÃÅ¡ and β = 105.53Ãâ¹ÃÅ¡ [5]. TGS provides rich lattice vibration spectrum below 300 cm-1[6]. The main disadvantage of TGS is its lower Curie temperature and easy depolarization by time, electrical, mechanical and thermal means. Because glycine has no asymmetric carbon and it is optically inactive. It is believed that doping of TGS with an optically active molecule will keep permanent polarization in TGS lattice. |
II RELATED WORKS |
| There are a large number of researches going on TGS to minimize the depolarization effect and to keep permanent polarization in TGS lattice. There is no change in crystal structure for Nd doped TGS and it is reported that Nd is coordinated with glycine[3]. But in the case of ADP and L-Asparagine doped samples change in crystal morphology is observed[7,8]. Tc value is higher for l-threonine, dl-threonine , l-methionine doped crystals and TGSP crystals[1,9]. It is observed that there is no low temperature phase transition in Lu-TGS[10]. No internal bias field is created for Pd doped TGS crystals and Ec is same as pure TGS crystals[11]. Spectral investigation of TGS doped with ADP, L-lysine, Ltryptophan, L-Cystine, Phosphoric acid reveals that doped samples have lower Spontaneous polarization values Ps and higher coercive field values compared to pure TGS. Higher Coercive field value implies that the crystal is in mono domain state [7,12-14,9]. Pyroelctric coefficient is increased for Thiourea, L-lysine , L-alanine and DL-alanine doped samples. [15-17]. Incorporation of Nitric acid and EDTA into TGS crystal increases the dielectric constant value.[18,19]. The substitution of amino acids l-threonine, dl-threonine , l-methionine and L-cystine results in the decrease of dielectric constant value compared to pure TGS crystal [1,14]. Zinc chloride and Urea doped samples exhibit Non-linear optical property and have S.H.G efficiency very much greater than standard KDP crystal.[20,21]. Incase of LGLM, La, Ce, Nd, Llysine doped TGS crystal strong internal bias field is created indicates that the dopant is reduced the depolarizing effects in TGS crystals. The internal bias field fixes the polarization in a preferential direction with minimum possibility of polarization reversal [22,23,16]. Doping of TGS with metal ions Fe3+, Cr3+ and Co2+ decreased the indirect band gap[24]. Investigation of TGS samples previously influenced by electric field E perpendicular to ferroelectric b axis reveals that there are rigid stripped domains parallel to c axis[25]. In present work pure and phosphoric acid, Zinc chloride admixtured TGS crystals are grown from solution. |
III CRYSTAL GROWTH AND CHARACTERIZATION |
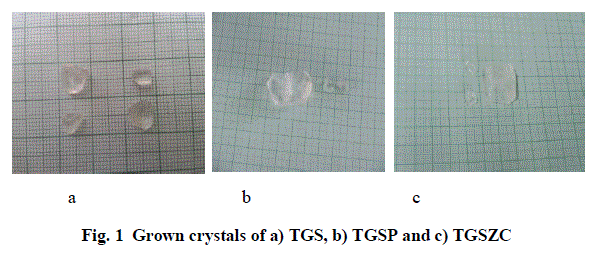
| Pure and Phosphoric acid, Zinc chloride admixtured TGS crystals were grown by solution growth method[5]. Grown crystals are shown in Fig. 1. UV-Vis absorption spectra of grown crystals are recorded in the wavelength range from 200-800nm using UVVis 2450 Make Shimadzu model spectrophotometer. FT-IR spectra are recorded in the frequency range from 400-4000cm-1 using IR Affinity Make Shimadzu model spectrophotometer. FT-Raman spectra were recorded in the frequency range from 0-3500cm-1 using the excitation radiation of 5145AÃâ¹ÃÅ¡ using Lab Ram HR 800 model spectrophotometer. Powder XRD pattern is obtained from BRUKER Diffractometer with CuKα radiation λ = 1.054 A0. Ferroelectric hysteresis study is carried out using homemade Sawyer-Tower circuit [26]. Electrical conductivity of grown crystals is tested using IMPEDENCE ANALYZER IM3570. NLO Study is carried out using Q-switched Nd:YAG Laser. |
 |
IV RESULTS AND DISCUSSION |
UV-Vis spectral investigation of grown crystals |
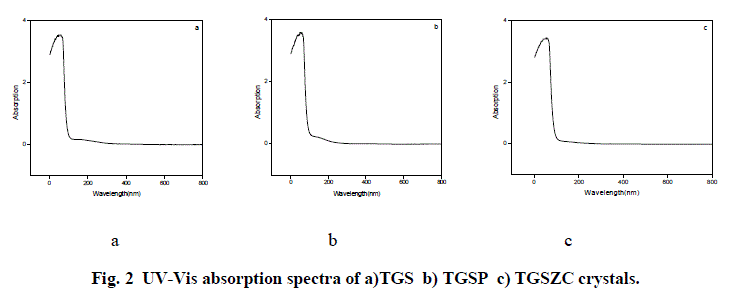
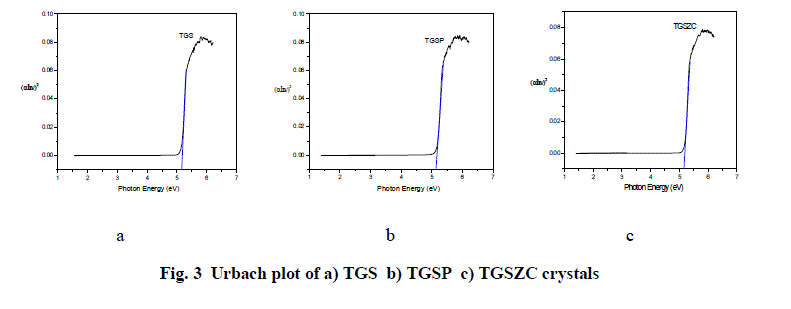
| Fig. 2 shows UV-Vis absorption spectra of TGS, TGSP and TGSZC crystals. For pure TGS wavelength of maximum absorption (λmax) occurred at around 233.5nm. For TGSP crystal λmax = 233nm. For TGSZC crystal, λmax = 232.5nm. Absorption at lower wavelength reveals that there must be higher energy transition corresponding to C = C – NO2 group. It is observed that all these crystals have transmission percentage of above 90%. Energy band gap values were found out using the relation E = 1240/λmax eV [27]. Also Energy band gap values are calculated using Urbach Plot and results are reported in Table 1. |
 |
 |
 |
FT-IR spectral analysis |
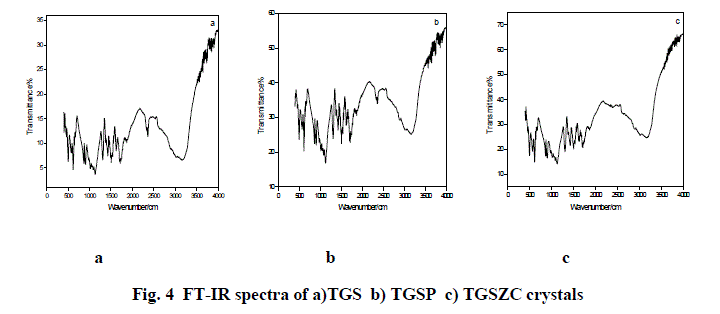
| Fig. 4 shows FT-IR spectra TGS, TGSP, and TGSZC crystals. FT-IR spectrum of pure TGS crystal matches very well with the earlier reported values[18]. All expected characteristic vibrations are observed and assignments were tabulated in Table 2. IR band at 1425 cm-1 and 1624 cm-1 corresponding to symmetric and asymmetric stretching vibrations of COO- indicate the Zwitter ion configuration of glycine [18]. IR bands observed in the region between 1716 cm-1 to 1869 cm-1 corresponding to stretching vibration of C = O indicate the presence of glycinium ion configuration [18]. Degenerate modes of NH3 bending and C = O, NH4 , C – H, O – H stretching vibrations are observed. FT-IR spectra of Phosphoric acid and Zinc chloride admixtured samples provide very similar features as that of pure TGS. More bands were located at same positions as that of pure TGS. There is a very slight shift observed in band positions compared to pure TGS. But doped samples provide less resolution of bands. Some bands are broadened and some are narrowed. Degeneracy is more for doped samples than that of pure TGS. |
 |
 |
| υs – Symmetric stretching |
| υas – asymmetric stretching, δ – bending, ρ – rocking, ω – wagging, τ – torsional vibrations. |
FT-Raman spectral analysis |
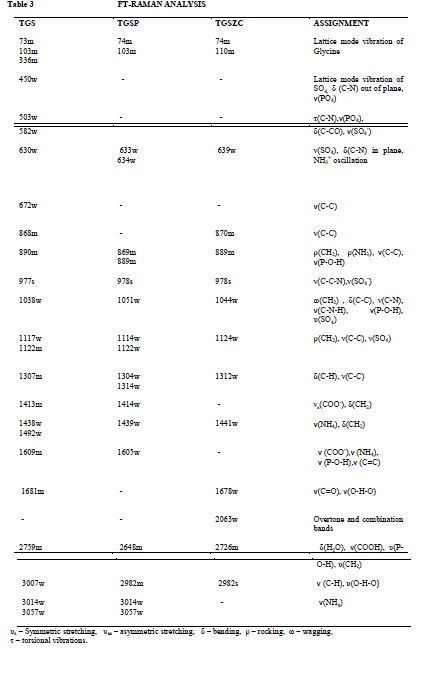
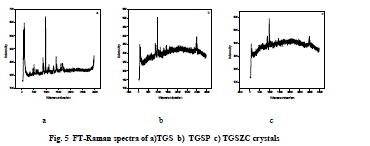
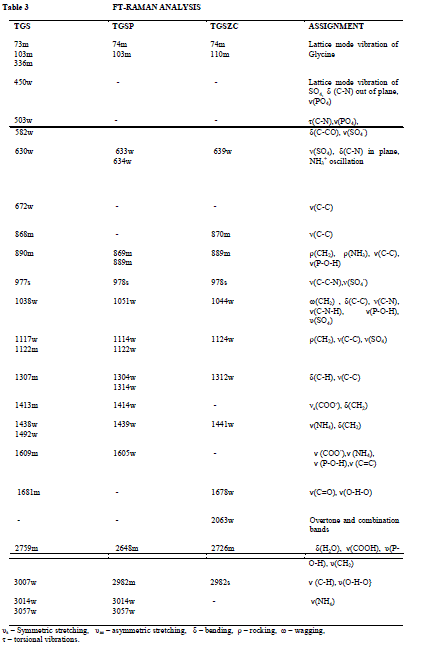
| Fig. 5 shows FT-Raman spectra of pure and doped TGS crystals. FT-Raman spectrum of pure TGS matches very well with the earlier reported values [3,18]. Obtained Raman bands and their assignments are tabulated in Table 3. Raman band observed at 1413cm-1 and 1609 cm-1 corresponding to symmetric stretching of COO- group confirms the Zwitter ion configuration of TGS crystal [3,18]. Band at 1681cm-1 corresponding to symmetric stretching of C = O group confirms the presence of glycinium ion configuration of TGS crystal [18]. In FT-Raman spectra of Phosphoric acid and Zinc chloride admixtured samples some peaks were shifted to a considerable range compared to pure TGS. There is a change in intensity of all peaks were observed. The amount of polarisability change will determine the Raman scattering intensity. So it can be concluded that change in intensity of peaks may be due to incorporation of dopants. |
 |
 |
Powder XRD study |
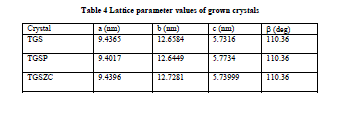
| Fig. 6 shows powder XRD pattern TGS, TGSP, TGSZC crystals. Sharp and well defined peaks are obtained for all crystals and matches very well with JCPDS card No. 14-0873. All crystals belong to Monoclinic Structure. XRD pattern of grown crystals differ from each other in intensity of reflection. Sharp and high intensity of reflection planes revealed that all crystals have good crystalline nature. Changes in Intensity of peaks for Phosphoric acid and Zinc chloride admixture samples compared to pure TGS revealed that there must be some changes in electron density in reflection planes due to the incorporation of dopants. Small change in 2θ value is observed for TGSP and TGSZC crystals. So pure and doped samples have different morphologies. Lattice parameter values are shown in Table 4. Obtained lattice parameter values for pure and doped crystals slightly differ from each other. Because of doping there may be some defects or strains in grown crystals. |
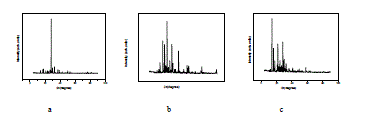 |
| Fig. 6 Powder XRD pattern of a) TGS b) TGSP c) TGSZC crystals |
| Table 4 Lattice parameter values of grown crystals |
Ferroelectric hysteresis study |
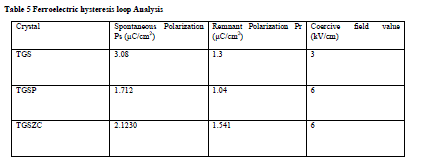
| Homemade Sawyer- Tower circuit is constructed [26]. Sample capacitors were prepared by using aluminium foils and the pure and doped TGS samples as dielectric in between the aluminium foils [28].Spontaneous polarization values (Ps) for all samples were obtained by using the equation P = Q/A micro coulomb/cm2 . Here Q = Charge measured on sample capacitor (coulomb). A = Area of capacitor plate (cm2) [28]. Results are shown in Table 5. Obtained Ferroelectric hysteresis loops for grown crystals are shown in Fig.7. |
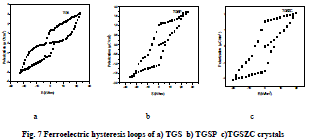 |
Table 5 Ferroelectric hysteresis loop Analysis |
 |
Electrical Measurement |
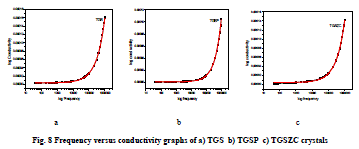
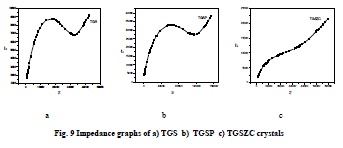
| Grown crystals are subjected to electrical characterization using IMPEDENCE ANALYSER IM3570. All crystals conduct electricity linearly. TGSZC crystal has higher electrical conductivity than pure TGS crystal. Results are shown in Table 6. Fig 8 shows electrical conductivity graphs of grown crystals. Fig 9 shows Impedance graphs of grown crystals. Electrical conductivity graphs of TGS, TGSP and TGSZC crystals contain two regions. Frequency independent Ac conductivity region in low frequency range and frequency dependent dc conductivity region in high frequency range. Conductivity graphs obey Arhenius relation and Jonscher’s power law [29,30,31,32]. For all grown crystals dc conductivity linearly increases with increase in frequency. This indicates that electrical conductivity of these crystals is due to hopping mechanism. Electrical conductivity σdc is obtained by non linear fitting for the conductivity graphs. Then hopping frequency ïÃÂ÷p is obtained by using the relation ïÃÂ÷p = (σdc/A)1/n. Here n is frequency exponent. A is temperature dependent parameter. Chargre carrier concentration is obtained by N = σdcT/ïÃÂ÷p. Mobility of charge carriers is obtained by μ = σdc/Ne. Here e is charge of electron [31]. From electrical conductivity analysis TGSZC crystal has maximum dc electrical conductivity, Hopping frequency and Mobility of charge carrier values. |
 |
 |
 |
 |
NLO Study |
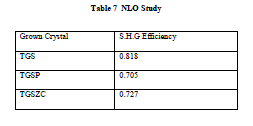
| Non linear optical property of grown crystals is tested using Q-switched Nd:YAG laser (1064 nm, Quanta ray series). Input power is 0.68 J/s. NLO study confirms that all grown crystals exhibit second harmonic generation. Conversion efficiency of grown crystals compared to standard KDP crystal for second harmonic generation is listed in table 7. |
 |
V CONCLUSION |
| From UV-Vis spectra of grown crystals it is confirmed that all these crystals have excellent optical quality.This property makes these crystals useful for applications in lasers, holographic recording, optical filters and Non-linear optical applications and electro- optic applications. From FT-IR and FT-Raman spectral investigations molecular structure of pure and Phosphoric acid, Zinc chloride admixtured TGS crystals are verified. Less resolution of peaks and change in intensity of peaks for doped samples compared to pure TGS are due to interaction between parent and dopants. It is concluded that Phosphoric acid and Zinc chloride were well incorporated into the lattice of TGS crystal. Ferroelectric hysteresis study reveals that for Phosphoric acid and Zinc chloride admixtured samples spontaneous polarization values were slightly decreased and coercive field values are increased compared to pure TGS. So doped crystals have improved Pyroectric behavior than pure TGS. So it can be concluded that Phosphoric acid and Zinc chloride admixtured TGS crystals are most suitable for Infrared detector applications. From Electrical conductivity graphs it is confirmed that grown crystals could be very useful for capacitor and other electrical applications. TGSZC crystals have higher electrical conductivity, hopping frequency and mobility of charge carrier values compared to pure TGS. From NLO Study it is confirmed that all crystals exhibit NLO property and pure TGS has maximum S.H.G efficiency compared to doped samples. So it is clear that all grown crystals are suitable for NLO and Opto electronic applications. |
ACKNOWLEDGEMENT |
| Authors are thankful to the Management of Karpagam University for providing the fecilities for the work, and to the Head, Department of Nanoscience and Technology , Bharathiyar university, for recording the Raman spectra. Authors are thankful to Karunya University, Coimbatore for recording powder XRD pattern for grown crystals and to Materials Research Centre, Karunya University, Coimbatore for recording Electrical conductivity graphs for grown crystals. Authors are thankful to Department of Physics, B.S.Abdur Rahman University, Chennai for their help to carry out NLO study for all samples. Also thanks are due to the faculty and research scholars of the Department of Physics, Karpagam university, Coimbatore for their help during the course of the work. |
References |
|