ISSN ONLINE(2319-8753)PRINT(2347-6710)
ISSN ONLINE(2319-8753)PRINT(2347-6710)
Eric M. Baer1, Mushtak T. Jabbar2
|
| Related article at Pubmed, Scholar Google |
Visit for more related articles at International Journal of Innovative Research in Science, Engineering and Technology
In this study we integrate multiple pre-processing, land use/cover classification, and change analysis detection techniques to develop a methodology and assess urban expansion change between 1988 and 2014 in the southern part of King County in Washington, USA using a 1:150 000 mapping scale. The results reveal an overall2.38 % growth in theurban area.Output land use/cover maps show that urban expansion has been associated with loss of agricultural land. Urban expansion was mainly attributed to the high growth in population, including a large number of immigrants from neighboring countries and other socio-economic changes. These results can provide city planners and decision makers with information about the past and current spatial dynamics of land use/ cover change and strictly urban expansion towards successful management for better planning and environmental monitoring.
Keywords |
| Geo-informationtechniques; Classification; Index; Seattle; USA |
INTRODUCTION |
| Urban expansion has been the defining global phenomenon during the past century. Particularly in the developing countries, urban population increase has been dramatically fast. In the time period between 1950 and 2005, annual urban population growths in Africa, Asia and Latin America have been 3.9%, 2.9% and 4% while those in Europe and North America are 1.2% and 1.9% respectively [1]. Between 2000 and 2030, the urban population in developing countries is expected to double, and entire built-up areas are projected to triple if current trends continue. In this process, various land-use problems emerged like arable land loss, land pollution and erosion, etc. |
| The study location was selected based on the background experiencewhere urban expansion was prevalent, since it had approximately32% of the total population of Washington, USA. Duringthe last 25 years urban expansion was very noticeablely drivenby high population growth rate of 2.1% [2]. |
| Previous studies have relied on remotely sensed information to classify land use/cover types either use raw data number values or calibrated reflectance, if a more precise material identification is needed. Geological and biological applications of TM data have also used simple band ratio techniques and spectroscopy to accentuate spectral features indicative of specific surficial materials, biomass, and vegetation health [3-7]. Land use/cover classification of urban areas has been problematic due to the heterogeneity and small spatial size of the surficial materials, which leads to significant subpixel mixing [8-9]. This problem becomes exacerbated when discrimination of multiple classes is necessary. Significant improvements in the accuracy of land cover classification in urban areas have been achieved using a variety of sophisticated approaches including: (1) the use of neural networks [10-12]; (2) fuzzy classification [13-15]; and (3) image texture analysis [16-18]. |
| The objective of this study is to detect and evaluate the landuse/cover change due to urbanization between 1988 and2014, and to analyze the main factors governing urbanizationand land use/cover change to inform urban planners of the changing conditions in the study area in order todevelop urban planning strategies that can protect the localenvironment. To perform the objectives of this study, twotime series analyses using remotely sensed data incombination with Geographical Information System (GIS)were employed. Specifically, land use/cover classificationschems for seven cities in the southern part of King Countywere identified using Landsat Thematic Mapper (TM) and Enhanced Thematic Mapper (ETM+); (1)to retrieve the two phases of urban boundary using supervised classification and NDBI respectively followed by comparison of the result derived from these two different methods, and (2) to map urban land use/cover, thus to identify the factors that caused land use/cover changes during the past 26 years; and (3) to propose strategies for development, while protecting limited farmland resources and ecological environment. |
MATERIALS AND METHODS |
Materials |
| Study Area: The study region selected was the southern part of King County in Washington state, USA (Fig. 1), representing a total area of 249.434 km2 between longitude -122o 42′ to -121o 99′ W and latitude 47o 26′ to 47o 51′ N. To study the urban expansion monitoring, the cities of Burien, Des Moines, Federal Way, Kent, Normandy Park, SeaTac, and Tukwila were selected as a study area. Thecities are situated in the southern parts of Seattle. Average population growth was estimated at 2.1% since 1990 [19-20]. In recent years, along with the increase of population, economic development, and improvement of investment environment, Seattle has witnessed a rapid urbanization, which has deeply affected the ecological environment in the urban and rural regions. |
 |
| Fig. 1: General location of study area showing cities boundary. |
| Spatial Database Using GIS and Remote Sensing: In this study used a Landsat 5 TM image of July 1988 and a Landsat 7 ETM+ image of July 2014. The orbit data of the two images is 46/27, and their spatial resolution of 28.5 m. A citylevel topographic map, geological map, soil map, meteorological data and all thematic layers were generated in a GIS environment at a scale of 1:150 000. The software’s packages used for this study were (ERDAS ver. 9.2), GIS (ArcGIS ver. 10.1), and SPSS (statistical analysis). |
Methods |
| Imagery pre-processing: The pre-processing for the dataset included image registration, radiometric calibration, and radiometric normalisation. Rectification and registration of TM and ETM+ imageries were based on control points collected from vector files of the large and small rivers at the study area using forty ground control points (GCP). The remotely sensed dataset were geometrically corrected in the datum WGS84 and projection UTM N10 using the first order (linear) of polynomial function and nearest neighbor rectification re-sampling, which was chosen in order to preserve the radiometry and spectral information in the imagery. Image to image registration was done in order to register the ETM+ image (dated 2014) with geo-coded TM image dated 1988 (master image). The RMS error of the image-to-map was 0.38 to 0.49 pixels, while was 0.19 to 0.25 pixels with image to image registration. The Landsat imageries were radiometric calibrated for sensor differences, converted into spectral radiance and normalized for illumination properties through differences in sun-elevation angle and sun–earth distance by recalculating the pixel values into at-satellite reflectance [7]. |
| Imagery post-processing: The basic idea of this research was to retrieve the urban boundary of different image phases using Landsat TM/ETM+ data, and then to analyze the impacts of urban expansion on land use/cover change (LUCC) (Fig. 2). A detailed illustration of data processing follows: |
 |
| Fig. 2: The flow chart of analyzing of urban land changes |
| Classification System: A supervised classification systemusing maximum likelihood algorithm was applied for land use/cover mapping from the three images.To map changes that had occurred in the southern part of King County from 1988 to 2014, six non-thermal bands of bothLandsat TM and ETM+ images were individually used asinput for maximum likelihood classification system. |
| Normalized Different Built-up Index (NDBI): NDBI was used to retrieve urban land from the Landsat imagery. The NDBI which is sensitive to the built-up area [21-22], and was created by analyzing the spectral characteristics of different land use/cover types. |
| NDBI = [(band5) = (band4)]/[(band5) = (band4)] |
| Where, bands (band4 and band5) of the Landsat TM or ETM+ images. |
| Rates of Land Use/Cover Change: Many models and indicators exist that are used to analyse the magnitude, rate and trend of LUCC [23-24]. This study relies on statistics to determine actual conversion rates of urban expansion. The following equation was used to calculate conversion rates [25]: |
 |
| Where X is the change rate of the land use and land cover, C1 is the class area at time t1 (1988); C2 is the class area at time t2 (2014); n the difference in years between the two dates (i.e. 26 years in this study). The study made use of a transition matrix to describe land conversion over the entire study period. A transition probability was adopted to conduct a trend analysis of landscape patch dynamics [26]. |
RESULTS AND DISCUSSION |
Assessment of land use/cover changes |
| The GIS capabilities allowed the post-classificationcomparisons, and facilitated a qualitative assessment of thefactors influencing urban expansion. There are seven land use/cover classes of interest in south part of King County: water, forested, forested urban, grass shrub crops, grass shrub urban, paved and bare land, and urban/built up areas. The spatial distributions ofthese classes were extracted from each of the land use/covermaps by using of GIS spatial analysis. The statistic land use/cover distribution for the two time series (1988 and2014) as derived from the maps are presented in Fig 3. |
 |
| Fig. 3: ( LUCC) classes monitored from satellite image for the study area. |
| The data revealed that during the 26-year period several land use/cover changes occurred; in particular a 18.1% decrease in vegetation areas was highlighted, corresponding to an average loss of 0.29km2year-1. On the contrary, paved and urban/built up areas increased by 13.1% and 6.1% respectively. The spatialdistributions of the seven classes were extracted from each landuse/cover maps of 1988 and 2014 as shown in Fig.4A and 4B. |
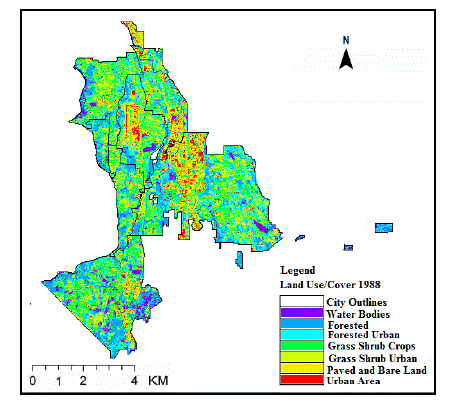 |
| Fig.4A: Land use/cover classification map of the study location based on analysis of TM. |
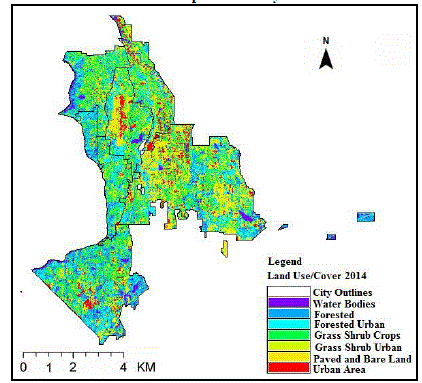 |
| Fig.4B: Land use/cover classification map of the study location based on analysis of ETM. |
| Using Table 1 and Fig. 3 together, significant changes in the LUCC can be recognized and type of LUCC conversion taking place can be identified. From 1988 to 2014 urban/built up areas saw an increase. Primarily due to a loss of vegetated land. This may suggest logging and development. During the same time span, paved and bare land also increased in size. The majority of this change came from the development of vegetation land into an urban class. Some of the marshes converted to unused land, while some of it was converted to urban. Finally vegetation areas saw a decrease in size. The largest portion was converted to urban/built up areas and a significant portion was developed in to paved and bare land. |
 |
| Table 1: Transition Matrix (Km2) of land use/cover maps (1988 and 2014) |
| As the accuracy assessmentrequired intensive visual analysis, the sub-change categoriesof each land cover type were aggregated into a singlechange class [27-29]. Therefore, the 10 differentclasses were aggregated into seven major subcategories, i.e.,Water, Forested, Forested Urban, Grass shrub Crops, Grass shrub Urban, Paved and Bare Land, and Urban/built up areas. The overall accuracy,kappa, producer and user accuracy values are presented in Table 2. |
 |
| Table 2: Information of accuracy assessment data used in this study. |
| Fig. 5 shows change rate of the land use and land cover processes between 1988 and 2014 with all lands grouped in two clusters. (1) Decreased of vegetation land for more than 1.2 % of the total land area and water surface loss for more than 0.2 per cent of the total land area, (2) More than 2.1 % of urban/built up areas and 1.2 % of the paved land was increased. The changes and spatial patterns of environment degradation processes during 1990–2003 will be analysed hereafter. |
| According to statistics of land use/cover thematic map, the total study area is 249.434 km2. There into, area of forested urban is about -2.816 km2 of total area, forested is about 0.277 km2, grass shrub crops is about -0.216 km2, grass shrub urban is about -4.521 km2, paved and bare land is about 3.104 km2, and urban/built up area is about 4.933 km2 (Fig. 3) . In the Table1, we calculated areas affected by various levels of land use/cover changein the southern part of King County in Washington. It is supposed that the whole area is subject to urbanization, as we mentioned previously, mainly by anthropogenic activities. |
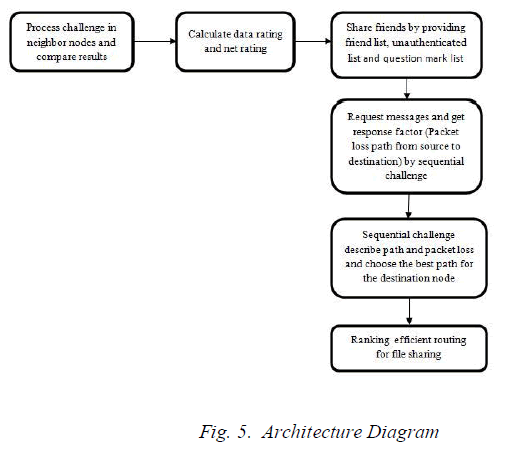 |
| Fig.5. Change rate of the land use and land covertypes expressed in percentages |
Assessment of Urban Expansion |
| In this research, the differences in urban area of seven cities between 1988 and 2014 were analyzed (Fig.6A and Fig.6B). The measurements make it possible to notice a significant increase of urban/built up area with respect to the time interval. The urban land cover increased from 3.6% to 6.1% (Table 3). The data reveals a significant increase in urban area with time; however, the magnitude of increase varied by location. The southern part of King County in Washington is considered a great economic and administrative center, the increase in its urban area was 14.9 Km2 from 1988 to 2014. Although the cities of Burien, Des Moines, Federal Way, Kent, Normandy Park, SeaTac, and Tukwila all experienced an increase in urbanization, with increases of 1.2%, 2.7%, 10.7%, 1.7%, 7.9%, 1.9%, and 1.5%, respectively. The statistical data of the census showed a general increase in the population of the whole study area. Population in the region increased from 166,389 in 1988 to 328,819 in 2014 with an accompanying increase in population density from 0.671 to 1.318 thousand Per/Km2(Table 4). From Table 4 we know that the changes of total population level of study location had presented a tendency to increase constantly in the past 26 years. In this period, the population has increased 162,430 with an annual urbanization growth rate of 2.5% per year (Table 3). The results of the statistical analysis showed that urban area has a significant correlation with increase population positive change (0.92). In general, the population is the major factor thatinfluenced the urban expansion. |
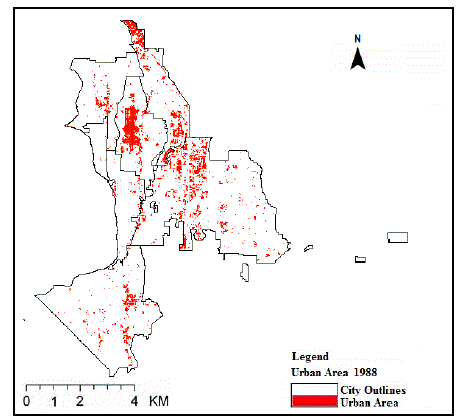 |
| Fig. 6A: The spatial change of the urban expansion of the study location in 1988. |
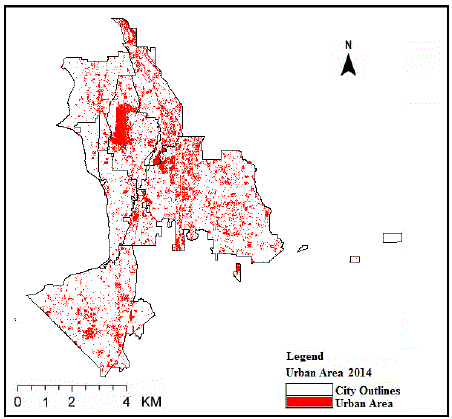 |
| Fig. 6B: The spatial change of the urban expansion of the study location in 2014. |
 |
| Table 3: Urban expansion statistics results for the study area during the period from 1988 to 2014. |
 |
| Table 4: The changes of total population growth in different cities. |
CONCLUSION |
| Evaluation of land use/cover patterns change is necessary not only for urban planning purposes, but also toimprove the management of land resources.This research has demonstrated the importance of using satelliteremote sensing and digital image processing together withGIS technique in producing accurate land use/cover mapsand change statistics for the southern part of King County in Washington, which isvaluable to monitor urban expansion effectively over a time.The change detection results of the study location show thaturban/built-up areas covered 9.056km2 (3.6%) in 1988 and 14.998km2 (6.1%) in 2014. Thisrepresents a net increase of 5.942 km2, which is mainlyattributed to the increase population due to the high growth rate, large number of immigrants and other socio-economic changes. In particular, during the period study a high percentage of agricultural lands were converted to urban areas and paved land. However, urban expansion was increased during the same period, which is considered as a key indicator that urban planning strategy should be given more attention. The preprocessing stage, such as the geometric corrections of multi-temporal satellite images as well as using the same classification scheme, is very important to enhance the accuracy of the results. This study concluded the advantage of remote sensing and GIS techniques that are indispensable for dealing with the dynamics of land use/cover change in the south part of Seattle over the last 26 years. Therefore, it is highly recommended that urban planners and decision makers can use remote sensing and GIS techniques for effective monitoring of urbanization trends. It will improve their predictions toward the amount of urbanization changes and the location of future built-up areas, and enhance the existing urban strategies for better sustainable land management. |
ACKNOWLEDGMENTS |
| This research was supported by the Highline College. The authors are grateful to the anonymous reviewers for their critical review and comments on drafts of this manuscript. |
References |
|