ISSN ONLINE(2319-8753)PRINT(2347-6710)
ISSN ONLINE(2319-8753)PRINT(2347-6710)
M. F. A. Alias1, Kh. M. Rashid2, K. A. Adem3
|
| Related article at Pubmed, Scholar Google |
Visit for more related articles at International Journal of Innovative Research in Science, Engineering and Technology
In this work, optical properties for thin doped ZnO films , prepared by pulse laser deposition (PLD) technique have been investigated as a function of various Ti concentrations( 0, 2, 4, 6, 8 and10) wt %. This study shows that the films have energy gap decreases from 3.3 eV to 2.4eVwith increasing Ti concentration from 0 to 10 wt%. The optical constants which are refractive index, extinction coefficient, real and imaginary constants were varied upon doping ZnO thin films with different Ti concentrations
KEYWORDS |
| Optical properties, pulse laser deposition, ZnO thin film, Ti concentration. |
I. INTRODUCTION |
| The ZnO is a wide and direct band gap semiconductor material [1].It has 3.37 eV energy gap at room temperature. Since ZnO gap energy lies in the ultraviolet (UV) range, ZnO is suitable for UV detection by using its photoconductivity properties [2]. The UV photodetector has a wide range of applications and it attracted great interest during the recent years. Most of the applications are directed toward the environmental monitoring, solar astronomy, and missile warning systems [3,4].Many different techniques such as organic chemical vapor deposition (MOCVD),chemical vapor deposition, plasma-assisted molecular beam epitaxy (PA-MBE), pulse laser deposition (PLD), and spray pyrolysis technique have been used to growth the ZnO[5-8]. |
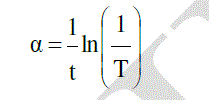
| The absorption coefficient (α) of semiconductor determined using the formula [9]: |
 |
| In the present work, the pulse laser deposition method has been used to deposit pure and Ti-doped ZnO thin films at different Ti concentrations. The influence of Ti doping on the optical properties of thin ZnO films has been investigated. |
II. EXPERIMENTAL PROCEDURE |
| Pure and doped zinc oxide powder at different doping concentrations for Ti with high purity (99.999%) were prepared by pressing them under 5 Ton to formed a target with 0.4 cm thickness. It should be as dense and homogenous as possible to ensure a good quality of the deposit. |
| ZnO: Ti thin films were deposited on glass substrate using pulse laser deposition (PLD) technique which carried out inside a vacuum chamber generally at (10-3Torr). The focused Nd: YAG (Huafei Tongda Technology— DIAMOND-288 pattern EPLS) .Prior to deposit films, the glass substrates were cleaned.The thickness of prepared films was about130nm which measured by Michelson interferometer. |
| An optical transmittance and absorbance spectra were recorded, at room temperature, in the wavelength range 300-1100nm using OPTIMA SP-3000 UV-VIS spectrophotometer. The optical energy gap was estimated by plotting the relations (αhυ)1/2,(αhυ)1/3,( αhυ)2/3,and (αhυ)2 versus photon energy (hυ) using eq.(2).The energy gap (Eg) is then determined by the extrapolation of the linear portion at (αhυ)2 =0 .An optical constants such as refractive index( using eq.(3)) , extinction coefficient, real and imaginary constants (using eqs.(4 and 5)) were calculated as a function of different Ti concentrations. |
III. RESULTS AND DISCUSSION |
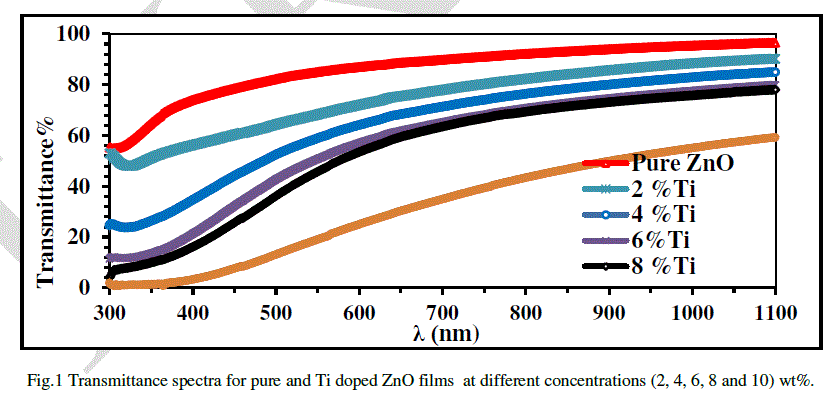
| Figure (1) shows the room temperature transmittance spectra for samples doped with different Ti concentrations. All spectra show good transparency, the transmittance pattern of all deposited thin ZnO films increases with increasing of wavelength (λ). On the other hand the transmittance decreases with the increase of Ti concentration which means increase in the reflection and absorption. This result is in agreement with results shown by Suhail et al.[13]. It is obvious from the figure that the transmittance for pure thin ZnO film at wavelength equal to 500nm was found to be 82.22%, while it is 12.99 for doped thin ZnO film with 10wt%Ti. |
 |
| Figs.(2) illustrates the variation of absorption coefficient with wavelength for ZnO thin film at different doping Ti concentrations. All spectra illustrate absorption coefficient pattern of all deposited pure and Ti doped thin ZnO films decrease with increasing of wavelength (λ) from 400 to 1100 nm. On the other hand the absorption coefficient increases with the increase of Ti concentration which means decrease in the reflection and transmition. Another noticeable remake is that the peaks of absorption coefficient pattern shifts to higher wavelength i.e. shorter photon energy (red shift) with increasing Ti concentrations. Table (1) illustrates all values of optical parameters. |
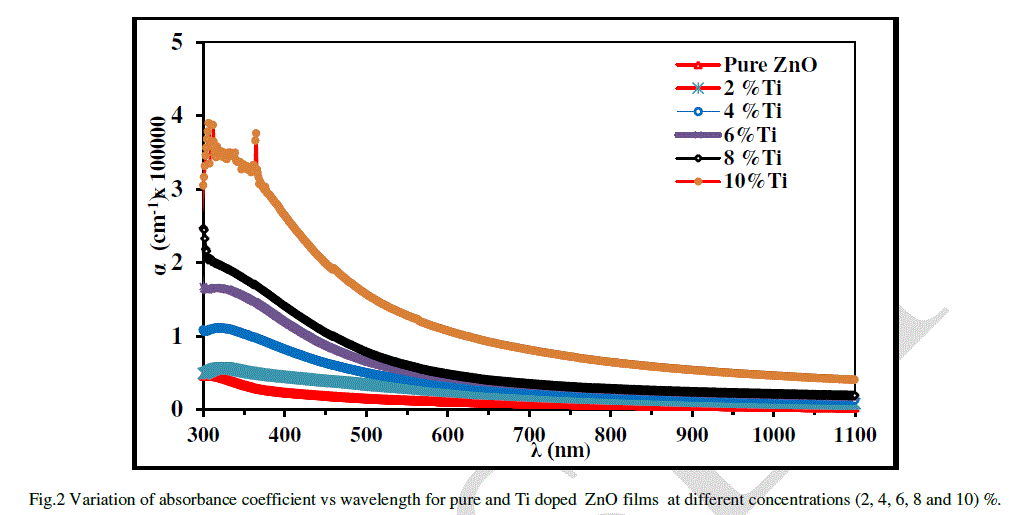 |
| Fig.2 Variation of absorbance coefficient vs wavelength for pure and Ti doped ZnO films at different concentrations (2, 4, 6, 8 and 10) %. |
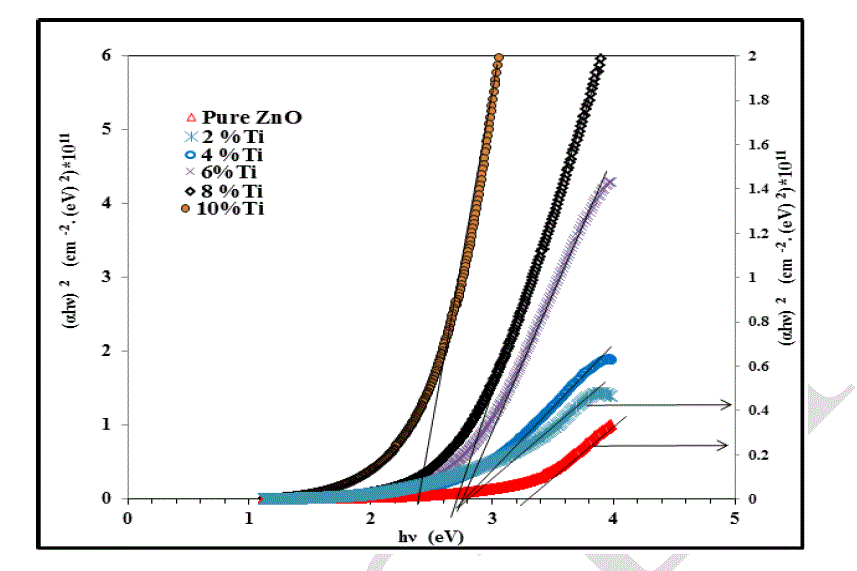
| It is found that the factor r equal to 1/2 from equation (2) yields linear dependence part at which the absorption coefficient α ≥ 104cm-1, which describes that ZnO film has the allowed direct transition. This result is in agreement with result had shown by Alias et al. [14]. |
| The variation of (αhυ)2 as a function of photon energy for pure and Ti doping thin ZnO film at different of Ti concentrations has been plotted in Fig. (3).This figure reveals that the increasing of Ti concentrations from 0 to 10 wt% leads to decrease the energy gap from approximately 3.3 to 2.2 eV respectively. This can be attributed to increase the mineral content and this result is in agreement with that observed by Carrey et al.[2].Also this decrease in Eg value after doping with Ti is attributed to that Ti introduces interband energy levels in the band gap of thin ZnO films which were responsible for the shift of optical Eg to lower band gap energy or higher wavelength (red shift). |
| It is important to determine the optical constants of thin films such as refractive index (n), extinction coefficient (k), and the real (εr) and imaginary (εi) parts of dielectric constant. |
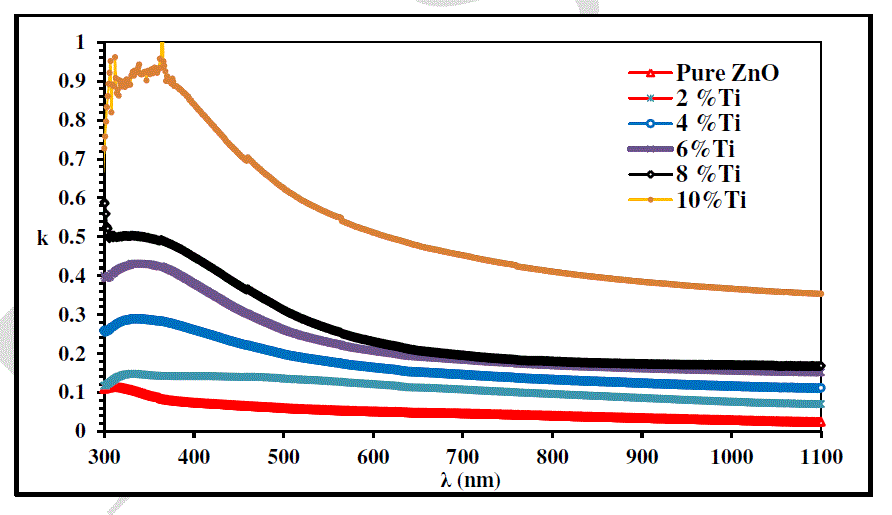
| Fig.(4) shows the variation of extinction coefficient (k = αλ/4π) with wavelength at different Ti doping concentration. The extinction coefficient depends mainly on absorption coefficient; for this reason, the behavior of it is similar for absorption coefficient i.e., the increasing of extinction coefficient with increasing photon energy because the absorption is increased and the peak shift to higher wavelength (red shift) with increasing Ti doping concentration. |
 |
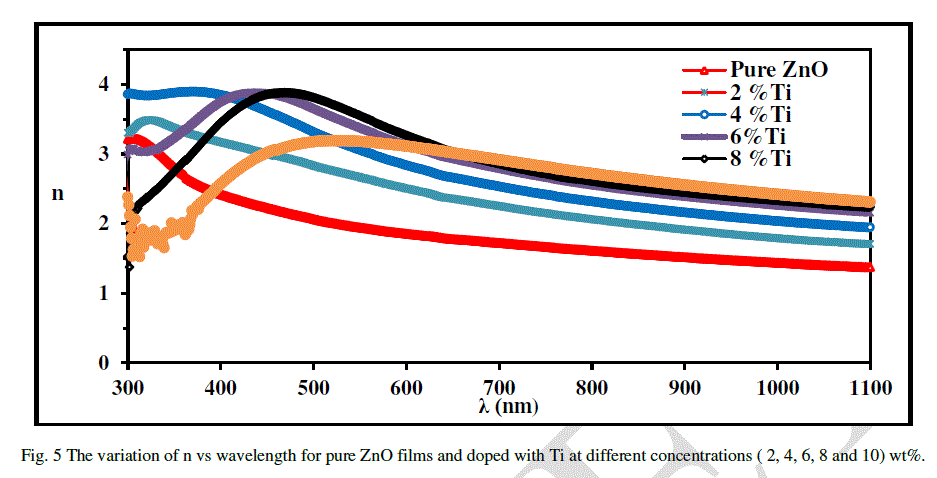
| The variation of the refractive index versus wavelength in the range 300–1100 nm, for deposited ZnO films on glass with different Ti doping concentration has been shown in Fig. (5). It is clear from this figure that the refractive index in general increases with increasing of Ti doping concentration . This behavior is due to the decrement in energy gap. Another noticeable remark is that the peak of curves is shifted to shorter photon energy (red shift). |
 |
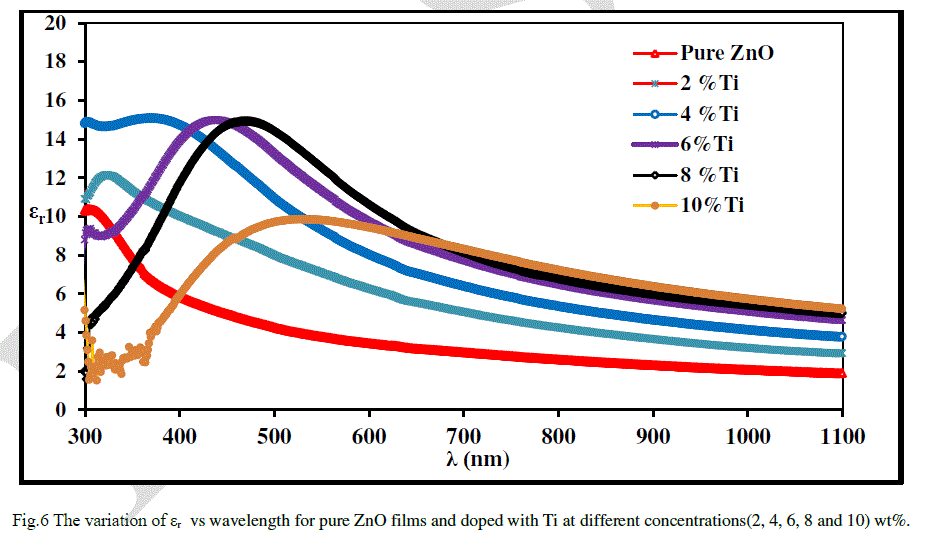
| The variation of the real and imaginary parts of the dielectric constants values versus wavelength have been shown in figures (6 and 7) for deposited pure and Ti doped thin ZnO films on glass with different doping concentrations. Their value are decreased with wavelength more than 500nm.The variation of the dielectric constant depends on the value of the refractive index. By contrast, the dielectric loss depends mainly on the extinction coefficient values which are related to the variation of absorption. |
 |
 |
| Table (1) illustrates the optical constants for pure and Ti doped thin ZnO films deposited on glass with different doping concentrations (0, 2, 4, 6, 8 and 10 wt %) at λ = 500 nm and the optical parameters values for these prepared samples. This Table shows that the values of α, k, n, εr and εi increase with increasing Ti dopant concentrations, whereas the behavior of T and Eg are opposite i.e., they decrease with increasing Ti doping concentrations. |
 |
IV. CONCLUSIONS |
| An Optical properties of pure and Ti doped thin ZnO films deposited by pulse laser deposition technique have been studied as a function of different Ti dopant concentrations. From the results of this study it can conclude that: |
| • The transmittance increases with increasing wavelength while it decreases with increasing Ti doping concentrations. |
| `• The energy gap decreases from 3.3 to 2.4eV with the increase of Ti doping concentrations from 0 to 10 wt% respectively. |
| • The optical constants values ( α, k, n, εr and εi) increase with increasing Ti dopant concentrations. |
References |
|