This paper aims at minimizing the real power loss in radial distribution system by Optimal Allocation and Sizing of Distributed Generation using Artificial Bee Colony Optimization (ABC) technique. The Artificial Bee Colony algorithm is a population-based optimization technique which is based on the intelligent foraging behavior of the honeybee swarm. Distributed generation is an approach that employs small scale technologies to produce electricity close to the end users of power. Here the total real power loss has been reduced by allocating two Distributed Generations in an IEEE 34 Bus Radial Distribution System using ABC technique and the results are obtained through MATLAB coding.
Keywords |
| Artificial Bee Colony Optimization technique (ABC), Distributed Generation (DG), Distribution
System, loss minimization. |
INTRODUCTION |
| Nowadays, electrical utilities are undergoing rapid restructuring process and are planning to expand their electrical
networks to meet the increasing load demand. Thus to plan future expansion and to meet the increasing electrical power
requirements, the concept of Distributed Generation (DG) is introduced. Distributed Generators are power technologies
of limited size that are directly interconnected at the consumer end. DG units may be of renewable or non-renewable
types which include wind power, solar power, micro turbines, fuel cells, etc. These Distributed Generators are also
called as embedded or dispersed generation and ranges from few KW to 100 MW. In Distribution System, due to load
uncertainties the load demand exceeds the generating capacity which leads to power loss and unreliable operation of the
system. To overcome this problem DG units are incorporated into the distribution system to meet the excess demand
which results in power loss minimization, improvement of voltage profile, power quality improvement, reliable
operation, etc. Since DG units are connected at the customer end, the cost of power distribution is also reduced. This
paper presents an optimization technique called Artificial Bee Colony (ABC) Algorithm to find the optimal location of
distributed generators in the distribution system such that the total real power loss of the radial distribution system is
minimized. |
METHODOLOGY |
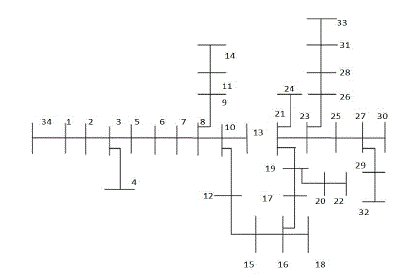
| The test system taken for optimal allocation of DG units is IEEE 34 bus radial distribution system as shown in Fig.
1. Initially the Newton Raphson Load flow is applied to the IEEE 34 bus radial distribution system and total loss is
found. Then to reduce the total real power loss of the radial distribution system, optimal allocation and sizing of
Distributed Generation (DG) using Artificial Bee Colony (ABC) Algorithm is done. Here 2 DG’s are considered for
allocation. Optimal location of DG is given by the bus that provides minimum power loss after DG penetration. |
PROBLEM FORMULATION |
| The objective function is to minimize the total system real power loss as given in Eq. 1 |
 |
| n Number of buses |
| Pi Real power flows from bus i to i+1 |
| Qi Reactive power flows from bus i to i+1 |
| Vi Bus voltage at bus i |
| r i+1 Resistance of line connecting buses i and i+1 |
| The fitness function to find the minimum loss is given in Eq. 2 |
 |
ARTIFICIAL BEE COLONY ALGORITHM(ABC) |
| The Artificial Bee Colony Algorithm was introduced by Karaboga in 2005. The bee colony consists of three types
of bees namely: employed bee, onlooker bee, and scout bee. The employed bee goes in search for food source
randomly and they share the information regarding the nectar amount of food source with onlooker bees waiting in the
hive by dancing. The nectar amount of the food source determines the time period of the dance. The onlooker bee
selects the best food source position by watching the dance of the employed bee which is the measure of the nectar
amount. The onlooker bee compares the dance of an employed bee with that of its neighbor and selects the food source
of the employed bee which dances for a longer duration as the optimal solution. Once the food source is selected the
onlooker and scout bees change to become employed bees and an employed bee after abandoning the food source
becomes a scout bee. The scout bee again searches a new food source. This search process continues until the best food
source position is found. There are three parameters in ABC algorithm namely: colony size or number of population
(NP), maximum cycle number and limit value. The colony size (CS) represents the total number of bees present. The
bee colony has equal number of employed bees and onlooker bees. Each food source has been given an employed bee
and thus the number of food source positions equals the number of employed bees. The maximum number of times the
search process has to be repeated is given by Maximum Cycle Number (MCN). Limit value gives the number of trials
after which a food source becomes exhausted. In this technique, the best food source is selected by comparing the
nectar amount of the current food source with that of the previous best food source position stored by the onlooker bee. |
| If the nectar amount of the current food source is higher than that of the previous one, then the best food source
position stored by the onlooker bee is modified as the current one or it will remain the same. In this manner the search
process will go on until the best food source position is found. The same principle can be used for finding the optimal
location of DG units. The DG units are placed at different locations in the IEEE 34 bus radial distribution system with
varying sizes and the power loss is calculated for each combination using Newton Raphson load flow. The power loss
of the successive combination is compared with the previous one and the best solution is retained. The combination that
gives the minimum power loss gives the optimal location and size of DG units. Thus the total real power loss
minimization after DG incorporation is found. |
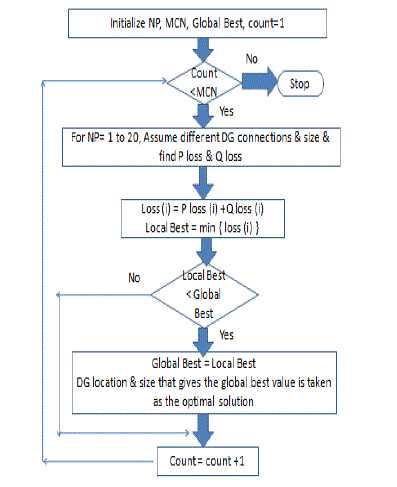
| Figure 2 shows the method of allocation of DG using ABC algorithm and Fig. 3 shows the flowchart of ABC
algorithm |
ABC ALGORITHM FOR DG ALLOCATION |
| 1. Initialize food source positions. |
| 2. Calculate nectar amount of food source using fitness function. |
| 3. Produce neighbor solutions and calculate their nectar amount. |
| 4. Apply the selection process. |
| 5. If all onlooker bees are distributed, go to step 9 otherwise go to the next step. |
| 6. Calculate probability values for the solutions. |
| 7. Produce neighbor solutions for the selected onlooker bee and evaluate them as Step 2 indicates. |
| 8. Follow step 4 |
| 9. Determine the abandoned solution for the scout bees, if it exists, and replace it with a completely new solution
and evaluate them as in Step 2. |
| 10. Memorize the best solution attained so far. |
| 11. If cycle = MCN, stop and print result. Otherwise follow Step 3. |
RESULTS AND DISCUSSION |
| A. POWER LOSS WITHOUT DG |
| Initially, the Newton Raphson load flow of IEEE 34 bus radial distribution system was performed and the loss
found is recorded in Table I. The real and reactive power loss in the system is given by P loss and Q loss respectively. |
| B. Power loss with DG |
| Then two distributed generators were optimally allocated and sized using Artificial Bee Colony Algorithm and the
loss was found by Newton Raphson method and the same is recorded in Table II. The real and reactive power loss in
the system is given by P loss and Q loss respectively. The parameters of ABC are given as follows: |
| 1. Colony size (CS) = 20 |
| 2. Maximum Cycle Number (MCN) = 55 |
| C. Optimal DG location and size |
| The Artificial Bee Colony technique is used to find the optimal location and size of two distributed generation
within the size limit of (0 – 5) MW and the same is recorded in Table III. All possible combinations of DG
interconnections are tried at varying sizes using ABC and the best combination that gives minimum power loss in the
IEEE 34 bus radial distribution system is taken as the optimal solution for DG allocation. |
| DG 1 and DG 2 are the two distributed generators considered for allocation in the IEEE 34 bus radial distribution
system. The optimal locations of DG 1 and DG 2 are at buses 10 and 31 respectively. The optimal sizes of DG 1 and
DG 2 are 0.3 MW and 0.1 MW respectively. |
| D. Loss Variation for different DG connection |
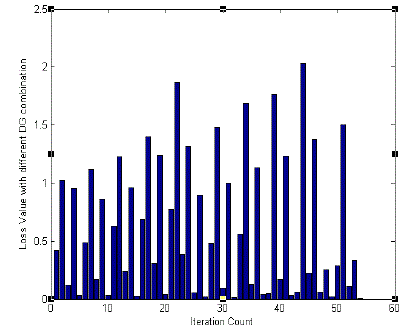
| In ABC technique, the DG is placed at different buses and the loss is found for each combination through an
iterative method. Figure 4 depicts the variation of losses for different DG placements during each iteration. It shows
that at iteration count 55, the best possible loss minimization is obtained. |
| E. Minimum Loss Occurrences |
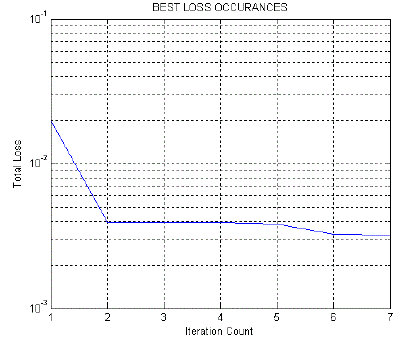
| In ABC technique, the DG is connected at different locations and the loss is found for each combination.
During every iteration the loss is updated as global best if it is minimum than the previous one. Figure 5 depicts the
global best solutions i.e the minimum loss updated during every iteration. |
CONCLUSION |
| In this paper, the real power loss of IEEE 34 bus radial distribution system has been reduced by optimal allocation of
Distributed Generation (DG) using Artificial Bee Colony Optimization technique. Initially, the Newton Raphson load
flow of the test system was performed before allocation of DG and the loss was found to be 0.09770 MW. Then a
distributed generation (DG) was optimally allocated and sized using Artificial Bee Colony such that the loss is
minimized after DG penetration and the loss was found to be 0.0022 MW. Thus a total real power loss reduction of
0.0954 MW was obtained as shown in Table IV. |
Tables at a glance |
 |
 |
 |
 |
| Table 1 |
Table 2 |
Table 3 |
Table 4 |
|
Figures at a glance |
 |
 |
 |
 |
| Figure 1 |
Figure 2 |
Figure 3 |
Figure 4 |
|
References |
- Abu-Mouti, F.S.; El-Hawary, M.E., “Optimal Distributed Generation Allocation and Sizing in Distribution system via Artificial Bee Colony Algorithm” IEEE Transactions on Power delivery, Vol. 26, No. 4, pp. 2090-2101, Oct. 2011
- M. E. Baran and F. F.Wu, “Optimal capacitor placement on radial distribution systems,” IEEE Trans. Power Del., vol. 4, no. 1, pp. 725–735, Jan. 1989.
- M. E. Baran and F. F.Wu, “Network reconfiguration in distribution systems for loss reduction and load balancing,” IEEE Trans. Power Del., vol. 4, no. 2, pp. 1401–1407, Apr. 1989.
- G. Celli, E. Ghiani, S. Mocci, and F. Pilo, “A multi-objective evolutionary algorithm for the sizing and the sitting of distributed generation,” IEEE Trans. Power Syst., vol. 20, no. 2, pp. 750–757, May 2005
- Duong Quoc Hung; Mithulananthan, N.; Bansal, R.C., “Analytical Expressions for DG Allocation in Primary Distribution Networks”, IEEE Transactions on Energy Conversion, Vol. 25, No. 3 , pp.814-820, 2010
- R. SrinivasaRao, K. Ravindra, K. Satish, and S. V. L. Narasimham, “Power Loss Minimization in Distribution System Using Network Reconfiguration in the Presence of Distributed Generation”, IEEE Transactions on Power Systems, Apr. 2012
- C. Wang and M. H. Nehrir, “Analytical approaches for optimal placement of distributed generation sources in power systems,” IEEE Trans. Power Syst., vol. 19, no.4, pp. 2068–2076, Nov. 2004.
|