In this paper, a new approach of optimal Economical sizing of a Hybrid PV-Wind energy system is presented in order to assist the designers to take into consideration both the economic and ecological aspects. This paper presentsthe various optimization techniques to design the hybrid PV-wind system. The hybrid system consists of photovoltaic panels, wind turbines and storage batteries. Genetic Algorithm (GA) and Teaching Learning Based Optimization (TLBO) optimization techniquesare utilized to minimize the formulated objective function, i.e. total cost which includes initial costs, yearly replacement cost, yearly operating costs and maintenance costs and salvage value of the proposed hybrid system. It also presents the application and performance comparison of GA and TLBO optimization techniques for optimal sizing of Hybrid PV/Wind energy system. Two computer programsare designed, using MATLAB code to formulate the optimization problem by computing the coefficients of the objective function. Finally, the optimal solution is achievedby GA& TLBO optimization method.
Keywords |
| GA, TLBO, solar energy, wind energy |
INTRODUCTION |
| Energy from renewable sources is being considered as a viable alternative to fossil fuels. Among them, wind and solar
energies have made a fast and significant breakthrough in the past 10 years. In addition, they can be consumed locally,
hence reducing both impacts from high-voltage transmission lines through rural and urban landscapes and power
losses. However, neither a solar nor a wind energy stand-alone system can fully satisfy load consumption because of
seasonal and periodic climatic variations. Therefore it is more reliable and efficient to install a hybrid energy system
with storage because of renewable energy sources intermittent character [1]. Global environmental concerns and the
ever-increasing need for energy, coupled with a steady progress in renewable/green energy technologies, are opening
up new opportunities for utilization of renewable energy resources. In particular, advances in wind and photovoltaic
(PV) generation technologies have increased their use in wind-alone, PV-alone, and hybrid PV-wind configurations.
Moreover, the economic aspects of these renewable energy technologies are sufficiently promising at present to include
the development of their market [2].A hybrid energy system consists of two or more energy systems, energy storage
system, power conditioning equipment, and a controller. Hybrid energy systems may or may not be connected to the
grid. They are generally independent of large centralized electric grids and are used in rural remote areas [3-5]. In many
remote areas of the world, the availability, reliability, and cost of electricity supplies are major issues. The standard
solution is typically to use diesel or petrol generators to meet power requirements in areas distant from established
electricity grids (Sustainable Energy Development Office 2010). There can be a number of problems with running
stand-alone diesel or petrol generation, including noise, pollution, and high running and maintenance costs. Generators
can also be inconvenient to use. Due to the high running and maintenance costs, continuous operation of a generator
may not be financially viable [6]. The use of hybrid energy systems, incorporating PV and wind resources, in remote
locations can overcome or at least limit some of the problems associated withgenerator only systems. The use of these
renewable energy-based systems could help reduce the emissions (such as COx, NOx and SOx) [7]. But such PV-wind
hybrid systems are usually equipped with diesel generators to meet the peak load demand during the short periods when
there is a deficit of available energy to cover the load demand [7, 8]. To eliminate the need of a diesel generator, a
battery bank can be used. Battery life is enhanced when batteries are kept at near 100% of their capacity or returned to
that state quickly after a partial or deep discharge [8]. The use of PV modules only does not protect batteries against
deep discharges. During periods of little or no sunshine, the load draws more energy than the PVs can replace. A more dynamic source of energy is a wind turbine. Adding a wind turbine to a system would protect batteries against deep
discharges and thus extend their life [8-10]. Many studies have been carried out in the area of sizing of PV-wind hybrid
energy systems. Generally, there are three main approaches to achieve the optimal configurations of such hybrid
systems in terms of technical analysis and economic analysis. These approaches are the iteration approach [8-14], the
probabilistic approach[15], and the trade-off approach[16]. However, these approaches are time-consuming and
difficult to adjust if insolation, wind speed, load demand, rating of each generator, and initial cost of each component
are changed. |
LITERATURE SURVEY |
| When the stand alone energy system having photovoltaic panels only or wind turbine only are compared with the
hybrid PV-wind energy systems, the hybrid systems are more economical and reliable according to climate changes
[17,18].Like Solar panels are too costly and the production cost of power by using them is generally higher than the
conventional process, it is not available in the night or cloudy days. Similarly Wind turbines can’t operate in high or
low wind speeds.A hybrid energy system usually consists of two or more renewable energy sources used together to
provide increased system efficiency as well as greater balance in energy supply. So these non-linear problems can be
solved by soft computing techniques, but which may not be accurate for multi objective functions. For example Fuzzy
Logic and Neural Network are soft computing techniques, which may not provide the precise result compared to
heuristic approaches like GA and PSO [13]. |
HYBRID SYSTEM STRUCTURE` |
| The increasing energy demand and environmental concerns aroused considerable interest in hybrid renewable energy
systems and its subsequent development. The generation of both wind power and solar power is very dependent on the
weather conditions. Thus, no single source of energy is capable of supplying cost-effective and reliable power. The
combined use of multiple power resources can be a viable way to achieve trade-off solutions. With combine of the
renewable systems, it is possible that power fluctuations will be incurred. To mitigate or even cancel out the
fluctuations, energy storage technologies, such as storage batteries (SBs) can be employed. The proper size of storage
system is site specific and depends on the amount of renewable generation and the load. The needed storage capacity
can be reduced to a minimum when a proper combination of wind and solar generation is used for a given site.The
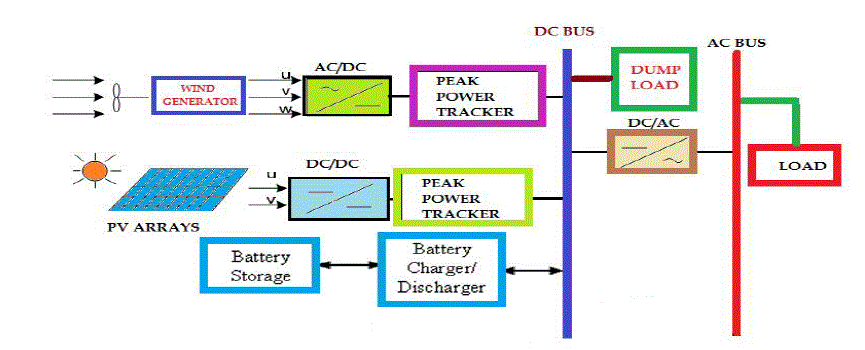
structure of the proposed PV-wind hybrid energy system is shown in Fig. 1. Because most electric appliances use
alternate current (AC) power supply, an inverter is used before the load. In order to guarantee the inverter working
normally, a dump load is used to consume the surplus energy generated by the system. The peak power trackers will
keep the PV array and wind generator operating at their maximum power operating points. The proposed method is to
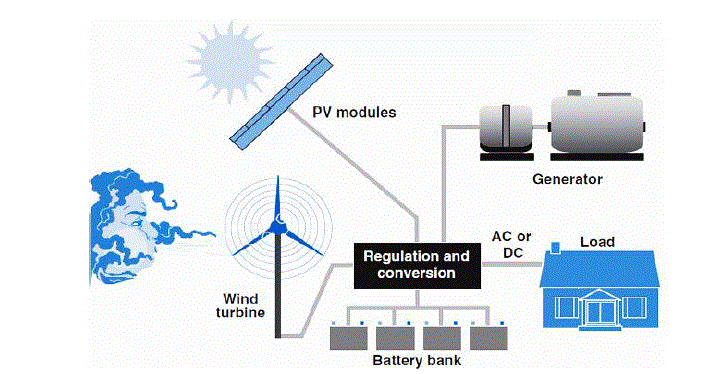
optimally size a PV-wind hybrid energy system to electrify a residential remote area household as shown in Fig. 2. |
PROPOSED PROBLEM OPTIMIZATION METHODOLOGY |
| Because of the intermittent solar irradiation and wind speed characteristics, which highly influence the resulting energy
production, the major aspects in the design of PV and WG power generation systems are the reliable power supply of
the consumer under varying atmospheric conditions and the corresponding total system cost. Considering the wide
range of commercially available device types, it is essential to select the number and type of PV modules, WGs and
batteries, and their installation details such that power is uninterruptedly supplied to the load and simultaneously the
minimum system cost is achieved. A design method forhybrid PV/WG systems, based on energy balance, has been
proposed [19]. Using the hourly average data of windspeed, solar radiation and consumer power demand, the difference
of generated and demanded power (Pd) any hour is calculated over a 24-h period. The numbers of PV modules and
WGs are finally selected, using an iterative procedure where the system operation is simulated for various numbers of
PVs and WGs, such that (Pd) has an average value of zero. The total annual cost for each configuration is calculated
and the combination with the lowest cost is selected to represent the optimal mixture. A method for the selection of the
optimum combination of battery and PV array in a hybrid PV/WG system has been presented by [8]. According to the
methods proposed by [16] the optimal sizes of the PV and WG power sources and the batteries are determined by
minimizing the system total cost function using linear programming techniques. The total system cost consists of both
the initial cost and yearly operation and maintenance costs. Common disadvantage of the methods described above is
that the proposed sizing methodologies do not take into account system design characteristics such as the number of
battery chargers; the PV modules tilt angle and the WG installation height, which highly affect both, the resulting
energy production and the installation and maintenance costs. Also, the minimization of the system cost function has
been implemented either by linearly changing the values of the corresponding decision variables or employing linear
programming techniques, resulting in suboptimal solutions and increased computational effort requirements.In this
paper, an alternative methodology for the optimal sizing of stand-alone PV/WG systems is proposed. The purpose of
the proposed methodology is to suggest, among a list of commercially available system devices, the optimal number
and type of units ensuring that the 5-year round total system cost is minimized subject to the constraint that the load
energy requirements are completely covered, resulting in zero load rejection. The 5-year round total system cost is
equal to the sum of the respective components capital and maintenance costs. The decision variables included in the
optimization process are the number and type of PV modules, WGs and battery chargers, the PV modules tilt angle, the
installation height of the WGs and the battery type and nominal capacity. The minimization of the cost (objective)
function is implemented employing a genetic algorithms (GA) approach, which compared to conventional optimization
methods, such as TLBO has the ability to attain the global optimum with relative computational simplicity. GAs have
been applied to the design of large power distribution systems and the solution of power economic dispatch problems
because of their ability to handle complex problems with linear or non-linear cost functions both, accurately and
efficiently. In the proposed method, GA is selected because it has shown to be highly applicable to cases of large nonlinear
systems, where the location of the global optimum is a difficult task. Due to the probabilistic development of solutions, GA is not restricted by local optima. Thus, given the number of non-linearities that exist in similar problems;
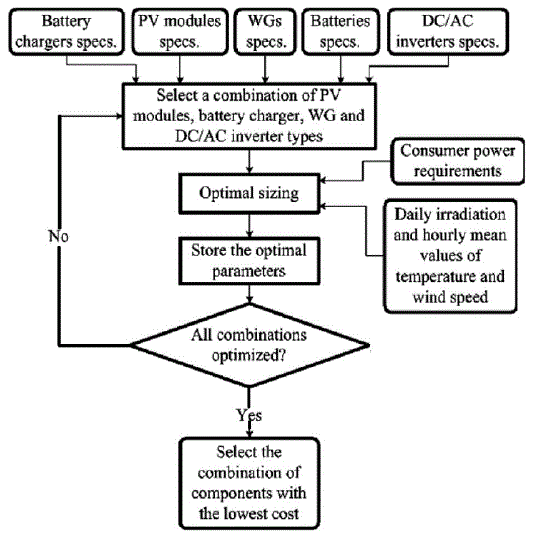
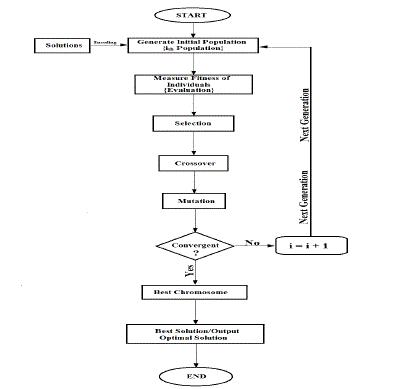
GA appears to be a useful approach. A general block diagram outlining the proposed methodology is shown in Fig. 3. |
METEOROLOGICAL AND LOAD DATA |
| The proposed method is to optimally size a PV-wind hybrid energy system to electrify a residential remote area
household near to latitude is 39.74˚ N, Longitude 105.18˚ W, Time Zone: - GMT-7, Elevation: -1829 m. MIDC/NREL
Solar Radiation Research Laboratory (BMS) is a good source for the long-term monthly average daily solar radiation
data (incident on both horizontal and south-facing PV array tilted by the latitude angle ϕ of the site) and wind speed
data (measured at 42 feet/12.8 m height in the site).The proposed method requires a recorded long-term wind speed
data and global insolation data (incident on a south-facing PV array tilted by the site latitude angle ϕ) for every day of
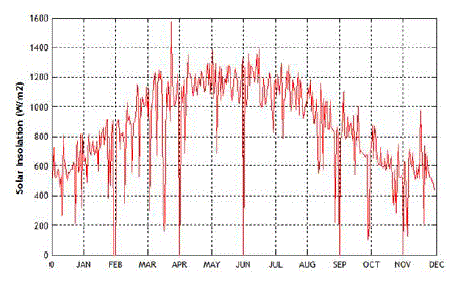
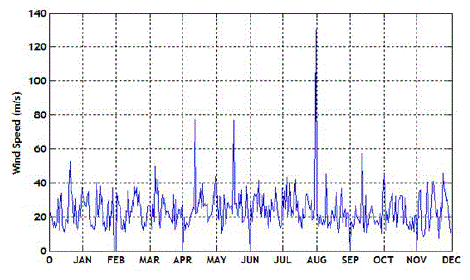
each month in a period of 1 year. Fig.4 and 5 show these data (i.e., the global solar insolation and windSpeed,
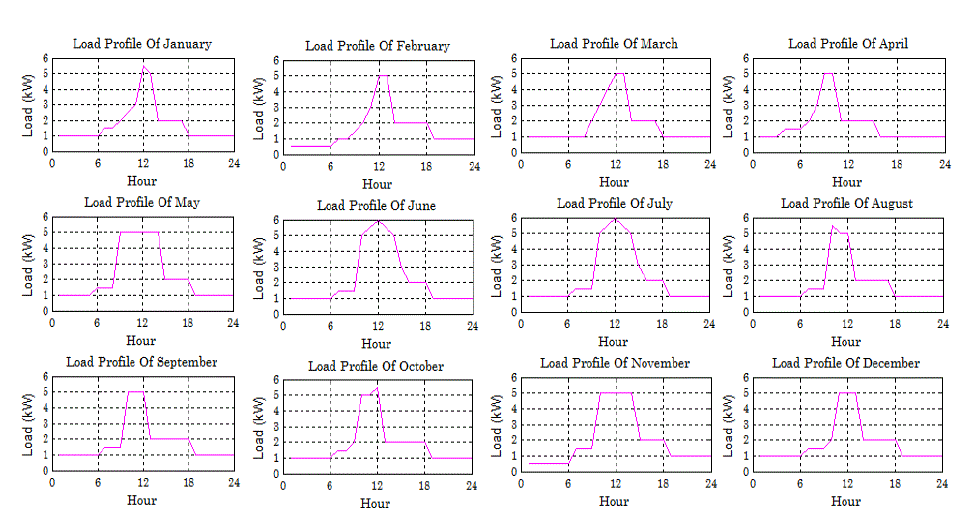
respectively) for every month in a typical year. Fig.6 illustrates the considered residential remote area load profile,
during the 12 months of the year. |
PROBLEM FORMULATION |
| The major concern in the design of the proposed PV-wind hybrid energy system is to determine the size of each
component participating in the system so that the load can be economically and reliably satisfied. Hence, the system
components are found subject to: 1. minimizing the total cost (CT) of the system, 2.ensuring that the load is served
according to certain reliability criteria.The objective function (CT) is to be minimized, and this cost function is
generated by the summation of the present worth (PWs) of all the salvage values of the equipment, the yearly operation
and maintenance costs, the initial or capital investments, and the replacement costs of the system components. Thus,
the objective function can be formulated as: |
 |
| where the index k is to account for PV, wind, and batteries; Ik is the capital or initial investment of each component
k; RPWk is the PW of the replacement cost of each component k; OMPWk is the PW of the operation and maintenance
costs of each component k; SPWk is the PW of the salvage value of each component k. The constraints that ought to be
met, while minimizing the objective function CT, should ensure that the load is served according to certain reliability
criteria. |
| A. Basic Economic Consideration |
| As Equation (1) suggests, the PWs of some annual payments as well as of salvage values are needed. Thus,
assuming a life horizon of N years for the project, an interest rate r, and inflation rate j (caused by increases in prices),
the different PWs can be calculated as follows [20]. |
| 1) Salvage Value |
| If a component has a salvage value of S (Rs.) at present (because it is reaching the end of its total or life cycle), then the
salvage value of the component is expected to be S (1+j) N(i.e., N years from now provided that the component is put in
service at the present time). The PW of S (1+j) N, taking the interest rate into consideration is [20]: |
 |
| Let, fac1= (1+j) N / (l+r) N, then SPWk = Sk facl, for all components k in the hybrid system. |
| 2) Operation and Maintenance |
| If the operating and maintenance cost of a component is OM (Rs. /year), then this tends to escalate each year at a rate
not necessarily equal to the general inflation rate. Thus, for escalation rate es the operation and maintenance costs
incurred at year y will be OM (1+es)y, and having a PW of: |
 |
| The summation of the PWs of all the annual payments is, thus, given by: |
 |
| Where fac2 represents a geometric progression, and is given by: |
 |
| Hence, OMPWk=OMk. fac2, for all components k in the system. Note that other PW calculations will be treated in a
similar manner throughout the analysis of each component. |
| B. Total Cost Coefficients |
| 1) The PV Array |
| Assuming the design variable, in case of the PV array, to be the total array area APV in square meters.This area is
constrained by both the maximum available area for the PV array(e.g., the roof surface of buildings)and
thebudgetpresetfor the PV modules. With an initial cost of αPV (Rs. /m2), the total initial investment would be: |
 |
| Note, here, that if the project life span is assumed to be the same as the PV array lifetime, then the replacement cost of
the PV modules will be negligible (i.e.,RPW1=0). With a yearly operation and maintenance cost of αOMPV (Rs. /m2/year),
the total yearly operation and maintenance cost would be OM1 = αOMPV. APV. Thus, the global PW of the yearly
operation and maintenance cost would be: |
 |
| The salvage value can be found by multiplying the selling price per square meter SPV by the area APV, and the PW of
the selling price would be: |
 |
| In summary, the PWs of the PV array costs are: |
 |
| 2) The Wind Turbine |
| The design variable due to the use of the wind turbine is the total rotor swept area Aw in square meters. This value is
constrained by both the space available and the budget of the project. Note that if Aw is known, then it is the task of the
designer to distribute Aw among several machines such that the summation of the individual areas gives Aw. Since the
lifetime of a wind turbine Lw is usually shorter than that of the PVarray N, then it might be necessary to purchase
additional wind turbines before the life span of the project comes to an end. The number of times, withinNyears, a wind
turbine is needed is Xw=N/Lw (rounded to the greater integer). If αw is the price in Rs. /m2 at present, the price at year ywould be αw.(1 +es)y having the PW of αw.(1 +es)y/(1+r)y . Thus, the PW of all the initial and replacement investments
in wind turbines is [20]: |
 |
| Where es is the escalation rate,r is the interest rate,Lw is the lifetime of wind turbines, and
Xw is the number of times wind turbines are purchased. Note that if Xw equals 1 (i.e., the life span of the wind turbines
is greater than or equal to that of the whole project), then RPW2 = 0 and I2 = αw.Aw (since the wind turbines are bought
once at the beginning of the project). With a yearly operation and maintenance cost of αOMw (Rs. /m2/year), the total
yearly operation and maintenance cost would be OM2=αOMw.Aw, and the PW of all the yearly costs would be: |
 |
| The salvage value of the wind turbine is assumed to decrease linearly from αw (Rs. /m2) to Sw (Rs. /m2), when the wind
turbine operates along its lifetime Lw (i.e., from its installation to the end of its lifetime, respectively). If the project life
comes to an end before the wind turbines have reached the end of their life span, then the wind turbines could be sold at
SPW (Rs. /m2), which is a value greater than Sw. |
 |
| where “years” indicates the number of years of operation between the installation of the last wind turbine and the end
of the project life span. Therefore, the PW of all the salvage values is found by: |
 |
| If N(i.e., the life span of the project) is a multiple of that of the wind turbines Lw, then Equation (12) can be reduced to: |
 |
| In summary, the PWs of the wind turbine are: |
 |
 |
 |
| 3) The Storage Batteries |
| The design variable in the case of storage batteries is their capacity Cb in kilowatthours. As in the case of wind turbine,
the lifetime of a battery Lb is expected to be less than that of the whole project. Hence, batteries of capacity Cb are to be
purchased at regular intervals of Lb. The total PW of the capital and replacement investments in batteries is given by: |
 |
| Where Lb is the battery lifetime, Xb is the number of times batteries should be purchased during the project lifetime, Xb
= N/Lb (rounded to the greater integer), andαb is the capital cost in (Rs. /kWh).The salvage value of the batteries is
assumed to be negligible. With a yearly operation and maintenance cost of αOMb (Rs. /kWh/year), the total yearly
operation and maintenance cost would be OM3 = αOMb.Cb, and the PW of all the yearly costs would be: |
 |
| In summary, the PWs of the battery costs are: |
 |
 |
| C. System Modelling |
| Modelling is an essential step before any phase of optimal sizing. For the proposed PV- wind hybrid system with a
storage battery, as shown in Figure 1, three principal subsystems are included, the PV array, the wind turbine generator
(WTG), and the battery storage. |
| 1) Modelling of the PV Array |
| In the proposed method, the system operation is simulated for one year with a time step of 1 h. The power produced by
the PV power sources is assumed to be constant during that time period. Therefore, the power generated by the
renewable energy sources is numerically equal with the energy generated within this time step.For a PV array having
an efficiency ηPV and area APV (m2), the output power PPV(kW), when subjected to the available solar insolation R
(kW/m2) on the tilted surface, is given by [12]. |
 |
| Here, the insolation R incident on the PV array is defined in Figure 4. |
| 2) Modelling of the WTG |
| A WTG produces power Pw when the wind speed V is higher than the cut-in speed Vci and is shut-down when V is
higher than the cut-out speed Vco. When Vr<V<Vco (Vr is the rated wind speed), the WTG produces rated power Pr. If
Vci<V<Vr, the WTG output power varies according to the cube law. The following equations are to be used in order to
model the WTG [8, 14]: |
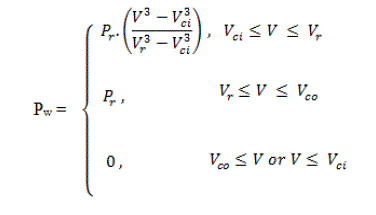 |
| Where |
 |
| In the above equation, Cp, ρair, and Aw are the power coefficient, air density, and rotor swept area, respectively.As the
available wind speed data Vi (see Figure 5) were estimated at a height Hi =12.8 m, then to upgrade these data to a
particular hub height H, the following equation is commonly used [2,8]: |
 |
| Where V is the upgraded wind speed at the hub height H and a is the power-law exponent (≈1/7 for open land). |
| 3) Modelling of the Storage batteries |
| At any hour t, the state of charge of the battery [SOC(t)] is related to the previous state of charge [SOC(t – 1)] and to
the energy production and consumption situation of the system during the time from t –1 to t. During the charging
process, when the battery power PB flows toward the battery (i.e., PB>0), the available battery state of charge at hour t
can be described by: |
 |
| Where Δt is the simulation step time (which is set equal to 1 hr), and Cb is the total nominal capacity of the battery in
kilowatt-hours.On the other hand, when the battery power flows outside the battery (i.e., PB<0), the battery is in
discharging state. Therefore, the available battery state of charge at hour t can be expressed as: |
 |
| To prolong the battery life, the battery should not be overdischarged or overcharged. This means that the battery SOC
at any hour t must be subject to the following constraint: |
 |
| where DODmaxand SOCmax are the battery maximum permissible depth of discharge and State Of Charge, respectively. |
SYSTEM RELIABILITY & SIMULATION |
| First of all, it is assumed, in this work, that the peak power trackers, the battery charger/discharger, and the
distribution lines are ideal (i.e., they are lossless). Also, it is assumed that the inverter efficiency ηinv is constant, the
battery charge efficiency ηb is set to equal to the manufacturers’ round-trip efficiency, and the battery discharging
efficiency is set to be 1.The total generated power by the PV array and WTG for hour t, Pg (t), can be expressed as: |
 |
| It is to be noted that the desired load demand at any hour t, PL*(t)
Pg(t) may or may not be satisfied according to the
corresponding values of the total generated power Pg (t) and the available battery SOC (t) at that hour. The proposed
energy management of the PV-wind hybrid system can be summarized as follows: |
 |
| As it is assumed, in this work, the simulation step time Δt is equal to 1 h and the generated PV and wind powers are
constants during Δt. Then, the power is numerically equal to the energy within Δt.The program for the calculation of
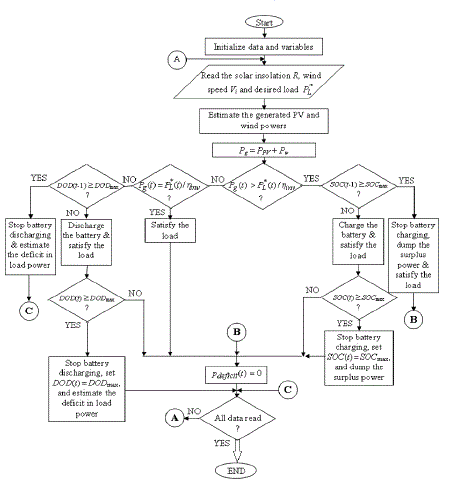
suggested PV-wind hybrid system was written in MATLAB code in an M-file. A flowchart diagram for this program is
shown in Fig. 9. The input data for this program consist of mean hourly global insolation on a tilted array R, mean
hourly wind speed Vi, and desired load power during the year����
. Note, here, that for every configuration of the
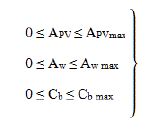
proposed PV-wind hybrid system, this program simulates the system.There are three additional bounds that should be
imposed on the sizes of the system components, which are: |
 |
 |
 |
FINAL FORM & OPTIMIZATION TECHNIQUES |
| At this stage, the optimization problem can be written in its final form as follows: |
| • Minimize the cost function CT |
 |
| • Subject to: |
 |
| To solve the above optimization problem, one of the soft computing approaches (GA) is proposed, where, in this work
[21], the Genetic Algorithm Code under MATLAB software is utilized for solving the previous optimization problem.
GA contains the elitist approach [22].This means that a solution cannot degrade from one generation to the next, but
that best individual of a generation is copied to the next generation without any changes being made to it. To use the
GA, for solving the formulated optimization problem, an M-file (MATLAB Code) has written, to compute the values
of the objective function (or called fitness function).The M-file has to be written to accept a vector (i.e., individual)
whose length is the number of independent variables for the objective function and return the corresponding scalar
values of the objective function (i.e., cost).In this work, the individual of the considered optimization problem contains
three variables (or genes), which are: APV, Aw, and Cb.The used GA is based uponusing the flowchart of Fig. 8, to yield
the optimal solution. Initially, the GA selects individuals at random from the current population to be parents and uses
them to produce the children for the next generation by using the three main operations, which are the selection,
crossover, and mutation operations. Then, it can repeatedly modify a population of individual solutions, where, over
successive generations, the population evolves toward an optimal solution. Note, here, that the used different settings in
the GA are 100 individuals for the population size,the stochastic uniform function for the selection operation, the
scattered crossover function (with a crossover probability of 80%) for the crossover operation, the adaptive feasible
mutation function (with a probability rate of 1%) for the mutation operation, and an elite individual. At the same time,
it is to be noted that the additional three bounds of Equation (28) can be entered directly in the dedicated positions of
the GA. |
| A latest optimization algorithm, named Teaching Learning-Based Optimization (simply TLBO) was proposed by R. V.
Rao et al, at 2011, for handling the optimization of mechanical design problems by considering the influence of a
teacher on learners. Afterwards, some improvements and practical applications have been conducted toward TLBO algorithm. However, as far as our knowledge, there are no such works which categorize the current works concerning
TLBO from the algebraic and analytic points of view [26].This algorithm mimics the teaching–learning ability of the
teacher and learners in a classroom. The teacher and learners are the two vital components of the algorithm. The
algorithm describes two basic modes of the learning: (1) through teacher (known as the teacher phase) and (2)
interacting with the other learners (known as the learner phase). The output in the TLBO algorithm is considered in
terms of the results or grades of the learners, which depend on the quality of the teacher. A high-quality teacher is
usually considered a highly learned person who trains learners so that they can achieve better results in terms of their
marks or grades. Moreover, learners also learn through interaction among themselves, which also helps to improve
their results. R. V. Rao et al. demonstrated that TLBO can obtain the better optimization performance in many fields,
e.g., the constrained mechanical design optimization problems, unconstrained and constrained real-parameter
optimization problems, and continuous non-linear large scale problems, in comparison with other optimization
algorithms. Then, a number of improvements and applications concerning TLBO have been proposed sequentially
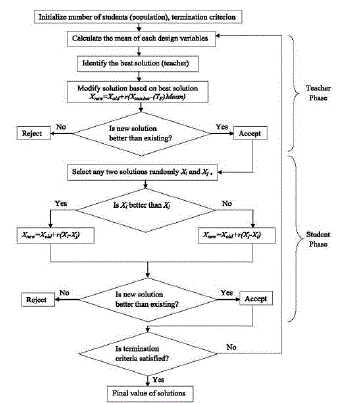
[26].The basic procedure for implementing the TLBO algorithm is as follows:Initialize the population size, design
variables and termination criterion, evaluate the initial population, Calculate the mean of each design variable and
select the best solution, Calculate the difference mean (Difference*, D = r (Mnew, D- TF X M*, D) and modify the solutions
based on best solution, The existing solution is updated as in Xnew, D = Xold, D + Difference*, D, If new solution is better
than existing then select the solutions randomly and modify them by comparing with each other and if not than
keep the previous solution and repeat step 3-5, If termination criterion is fulfilled then take the final value of the
solution. Fig 9 shows the flow chart of TLBO algorithm and its operation for non-linear problems. |
APPLICATION RESULTS AND DISCUSSION |
| The formulated optimization problem of the PV-wind hybrid energy system is solved, in this work, by using the GA
and TLBO under MATLAB software, which may provide a number of potential solutions to the given problem. The
choice of the final optimum solution is left to the system’s designer. The specifications and the related maintenance and
installation costs of different wind turbines, PV panels and batteries, which are input to the optimal sizing procedure,
are listed in Tables I-III. The maintenance cost of each unit per year and the installation cost of each component have
been set at 0-1% and 5-10% respectively of the corresponding cost. The life time of Wind Turbine, PV panel and
Battery is considered to be 5 years. Since the tower heights of wind turbines affect the results significantly, 12.8m
meter high tower at an elevation of 1829m is chosen. The minimization of the system total cost is achieved by selecting
an appropriate system configuration. In Table IV, it indicates the compared result of optimum sizes of the different
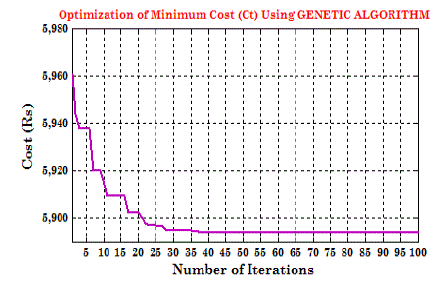
components included in the hybrid system. The corresponding fitness function optimization (i.e., minimization of the
system cost in rupees) along the successive generations of the GA is shown in Fig 10, which indicates that the system is
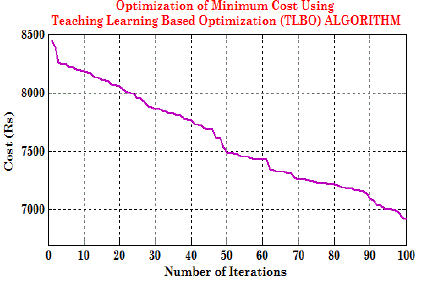
optimized after forty iterations only. Similarly In another M-file a MATLAB code has written for proposed hybrid
PV/Wind energy system using Teaching Learning Based Optimization (TLBO) algorithm. The corresponding fitness
function optimization (i.e., minimization of the system cost in rupees) along the successive iterations of the TLBO is
shown in Fig 11, which indicates that the system is not optimized even after hundred iterations. Table-VI shows a
comparison between the costs that resulted from solving the formulated optimization problem by using the proposed
GA-based technique and the TLBO algorithm using MATLAB software. Thus, Table-V indicates that the proposed
GA-based technique is better than the TLBO algorithm, in solving such optimization problems, and this is due to the
fact that the GA is capable to converge to the global optimum solution instead of convergent at a local optimum one.
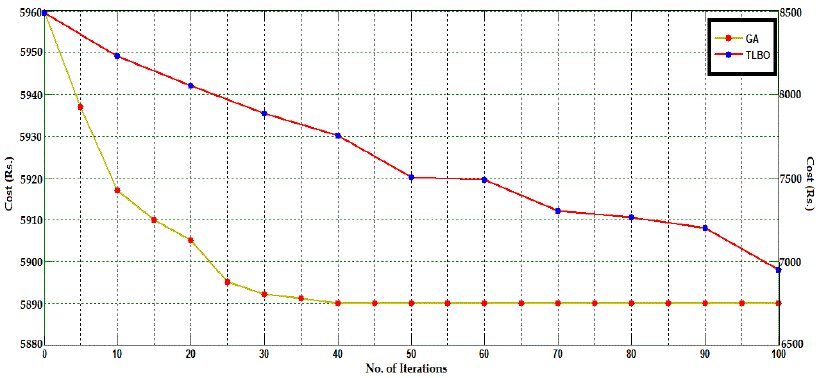
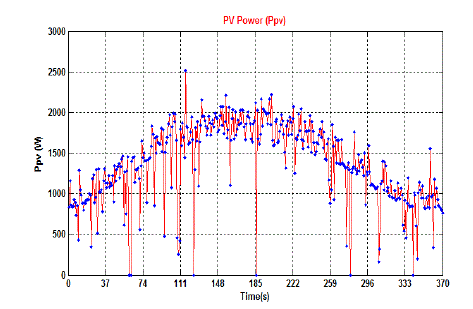
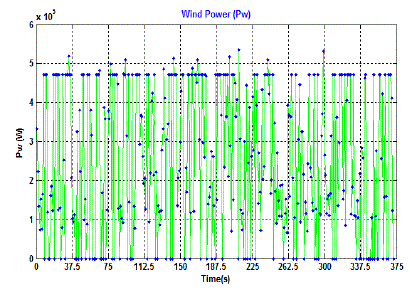
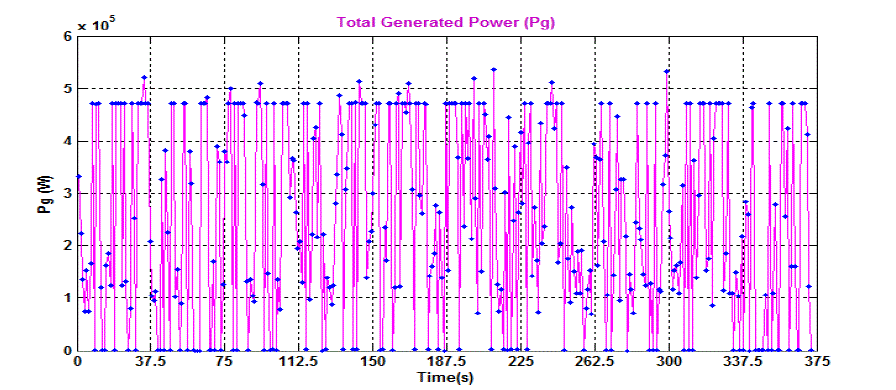
Fig 12 shows the comparison of result using GA and TLBO, where GA is most efficient than other.Figure 13, 14, and
15 illustrates the generated PV power, wind power, and the total generated power of the suggested PV-wind hybrid
system, for every month during the year. |
CONCLUSION |
| This paper presents a GA& TLBO-based optimization technique to optimally size a proposed PV-wind hybrid
energy system, incorporating a storage battery. The optimization problem is formulated, in this work, to achieve a
minimum total cost for the system components and to ensure that the load is served reliably. The results yield that the
GA converges very well and the proposed technique is feasible for sizing either of the PV-wind hybrid energy system,
stand-alone PV system, or stand-alone wind system. In addition, the proposed techniquesare able to be adjusted if
insolation, wind speed, load demand, and initial cost of each component participating in the system are changed. The
results yield, also, that the PV-wind hybrid energy systems are the most economical and reliable solution for
electrifying remote area loads. |
Tables at a glance |
 |
 |
 |
 |
 |
| Table 1 |
Table 2 |
Table 3 |
Table 4 |
Table 5 |
|
Figures at a glance |
 |
 |
 |
 |
 |
| Figure 1 |
Figure 2 |
Figure 3 |
Figure 4 |
Figure 5 |
 |
 |
 |
 |
 |
| Figure 6 |
Figure 7 |
Figure 8 |
Figure 9 |
Figure 10 |
 |
 |
 |
 |
 |
| Figure 11 |
Figure 12 |
Figure 13 |
Figure 14 |
Figure 15 |
|
References |
- .Bernal-Agustin, J.L., Dufo-Lopez, R.: ‘Simulation & optimization of stand-alone Hybrid renewable energy systems’, Renew. Sustain. EnergyRev., 2009, 13, (8), pp. 2111–2118.
- . Kellogg, W.D., M.H. Nehrir, G. Venkataramanan, and V. Gerez. 1998. Generation unit sizing and cost analysis for stand-alone wind, photovoltaic, and hybrid wind/PV systems. IEEE Trans. on Energy Conversion 13(1): pp:70–75.
- . Gupta, A., R.P. Saini, and M.P. Sharma. 2007. Design of an optimal hybrid energy system model for remote rural area power generation. InProceedings of the IEEE International Conference on Electrical Engineering (ICEE 2007), Lahore, Pakistan, 1–6.
- . Hongxing, Y., Z. Wei, and L. Chengzhi. 2009. Optimal design and techno-economic analysis of a hybrid solar–wind power generation system.Applied Energy 86: 163–169.
- . Roman, E., R. Alonso, P. Ibanez, S. Elorduizapatarietxe, and D. Goitia. 2006. Intelligent PV module for grid-connected PV systems. IEEETransactions on Industrial Electronics 53(4):1066–1073.
- . Colle, S., S. Luna, and R. Ricardo. 2004. Economic evaluation and optimization of hybrid diesel/PV systems integrated to utility grids. SolarEnergy 76: 295–299.
- . Wies, R.W., R.A. Johnson, A.N. Agrawal, and T.J. Chubb. 2005. Simulink model for economic analysis and environmental impacts of a PV withdiesel-battery system for remote villages. IEEE Transactions on Power Systems 20(2): 692–700.
- . Borowy, B.S., and Z.M. Salameh. 1996. Methodology for optimally sizing the combination of a battery bank and PV array in a wind/PV hybridsystem. IEEE Transactions on Energy Conversion 11(2): 367–375.
- . Prasad, A.R., and E. Natarajan. 2006. Optimization of integrated photovoltaic-wind power systems with battery storage. Energy 31: 1943–1954.
- . Shaahid, S.M., and M.A. Elhadidy. 2008. Economic analysis of hybrid photovoltaic-diesel-battery power systems for residential loads in hotregions-a step to clean future. Renewable and Sustainable Energy Reviews 12: 488–503.
- . Ai, B., H. Yang, H. Shen, and X. Liao. 2003. Computer aided design of PV/wind hybrid system. Renewable Energy 28: 1491–1512.
- . Diaf, S., D. Diaf, M. Haddadi, and A. Louche. 2007. A methodology for optimal sizing of autonomous hybrid PV/Wind system. Energy Policy35: 5708–5718.
- . Senjyu, T., D. Hayashi, N. Urasaki, and T. Funabashi. 2006. Optimum configuration for renewable generating systems in residence usinggenetic algorithm. IEEE Transactions on Energy Conversion 21(2): 459–466.
- . Yang, H., L. Lu, and W. Zhou. 2007. A novel optimization sizing model for hybrid solar-wind power generation system. Solar Energy 81: 76–84.
- . Karaki, S.H., R.B. Chedid, and R. Ramadan. 1999. Probabilistic performance assessment of autonomous solar-wind energy conversion systems.IEEE Transactions on Energy Conversion 14(3): 766–772.
- . Chedid, R., H. Akiki, and S. Rahman. 1998. A decision support tech. for the design of hybrid PV/wind systems. IEEE Transactions on EnergyConversion 13: 76–82.
- . Ai Bin, Yang Hongxing, ShenHui and Liao Xiaobo, “Computer aided design for PV/wind hybrid system,” Proceeding of 3td WorldConference on Photovoltaic Energy Conversion, vol. 3, pp.2411-2414, May, 2003.
- . Belfkira R, Hajji O, Nichita C and Barakat G, “Optimal sizing of standalone hybrid wind/PV system with battery storage,” 2007 EuropeanConference on Power Electronics and Applications, pp.1-10, Sept, 2007.
- . http://lcm.csa.iisc.ernet.in/TDM/hybrid.html.
- . Sweelem, E.A., and A.A. Nafeh. 2006. A linear programming technique for optimally sizing a PV-diesel-Battery hybrid energy system. Al-Azhar University Engineering Journal 9(3): 705–716.
- . Renshburg, P.J.V., I.S. Shaw, and J.D.V. Wyk. 1998. Adaptive PID-control using a genetic algorithm. In Proceedings of the 2nd InternationalConference on Knowledge-Based Intelligent Electronic Systems, 133–138.
- . http://en.wikipedia.org/wiki/Genetic_algorithm.
- . http://www.civil.iitb.ac.in/tvm/2701_dga/2701-ga-notes/gadoc/gadoc.html.
- . http://www.doc.ic.ac.uk/~nd/surprise_96/journal/vol1/hmw/article1.html#introduction.
- . http://c2.com/cgi/wiki?GeneticAlgorithm.
- . Rao, R.V., Savsani, V.J., and Vakharia, D.P., 2011. Teaching–learning-based optimization: a novel method for constrained mechanical designoptimization problems. Computer-Aided Design, 43, 303–315.
- . Rao, R.V., Savsani, V.J., and Vakharia, D.P., 2012. Teaching–learning-based optimization: an optimization method for continuous non-linearlarge scale problems. Information Sciences, 183, 1–15.
|