Optimal placement of switching devices is a very important for distribution networks‟ planning, operation and cost minimization. Further identifying optimal placement of switches is typical if the distribution system consists of Distributed Generators (DGs). Generally DGs are used to reduce the losses, to improve the voltage profile and to increase the reliability of the system. Further in order to improve the system behavior it is required to place the switching devices at the optimal locations. This work finds the optimal configuration of the DG equipped distribution system with optimally placed switching devices. In this work a Particle Swarm Optimization was used achieve the goal and results are compared with the existing GA method.
I. INTRODUCTION |
| Growth of Electric power demand is a critical issue of every power utilities as they have to supply good
quality of power to all the consumers with the least cost and with least interruptions. Increasing the capacity of a
substation is the general solution for the additional load demands but involves the high cost because increasing the
capacity of a substation will leads to go for increasing the distribution, transmission and generation capacities which
further requires huge amount of money. To overcome the above problem a small capacity generating stations (such as
solar, wind, diesel) of less capacity (normally less than 10MW) are going to be installed and are called as Distributed
Generators (DGs). Optimal placement of such DGs will not only meets the growth in power demand and also decreases
the power losses and improves the voltage regulation and reliability too. Many papers were published on the optimal
placement of DGs [1-4]. [1] Reported some successive experiences of DG happed in central Virginia Electric
Cooperative. [2] Proposes a method for DG planning based on genetic algorithm. The paper aimed on the cost
evaluation. [3] Proposed some processes for DG planning that also permit the incorporation of distribution automation
and demand side management. [4] Proposed some guidelines for DG planning. Some papers also worked with the
impact of various aspects on DG equipped Distribution Systems. At present the research is going on DG impact on
distribution system on relay protection fault location [5], islanding algorithm [6], and reliability evaluation [7].
Reference [8] optimizes the placement of protection devices to improve the system reliability with DG. |
| In general DG generation has random, intermittent and fluidity in its output. When DG is in islanding
operation, the DG impact on the distribution system reliability depends on the probability that the DG can maintain an
island. The greater the probability of island formation, the shorter the desire outage time and obviously the reliability
of the system will be higher. This work by considering the random variation nature of the DG output and the system
load curve, we allocate the optimal number and locations of switching devices. |
| In recent years, distributed generation technology has developed greatly. Specifically as IEEE 1547-2003
standard issued, distributed power‟s islanding operation is much accounted of people for improving the efficiency of
electrical power system. Distributed generation is expected to play an imported role in the emerging power
systems[10]. Presently DG impact on distribution system is studied on relay protection fault location[11], islanding
algorithm[12] and reliability evaluation[13]. Reference[14] optimizes the placement of protection devices to improve
reliability of distribution system with DG. But in that paper DG is taken as conventional generation stations. It can not
properly reflect DG impact on reliability. |
| In DG equipped distribution system, considering the randomness of the DG output, for the load points on DG
side, the reliability is not only depends with the location of switches but also influenced by the islanding probability. If
the islanding probability of the load point is too low, even though the load point is within the island, it may also be
interrupted due to lack of output of DG, the reliability will not improve. So when the number of disconnect switches is
increased, outage costs will not necessarily reduce. |
| A. Objective Function: |
| Switch Optimization model of DG equipped distribution system can be represented in the objective function as |
 (1) (1) |
| Where, Icost is switch investment cost |
| Mcost is operation and maintenance cost |
| Ocost is desire outage cost |
| B. Constraints: |
| Subjected to a Constraints of |
 (2) (2) |
 (3) (3) |
| Where R is the system reliability index under a chosen switch configuration, Ro is the reliability level that planning
requires |
| Equation 3 is the expected energy not supplied constraint; Wmax is the maximum lack of power supply that can be
defined as |
 (4) (4) |
| Where PL is the total load of the system, RASAI is the reliability on service in total that planning requires. |
| Investment Costs of the switches can be calculated based on the life of switch and number of switches in the
system as |
 (5) (5) |
| Where Nk is the number of switches, Cs is the investment cost of each switch, i is the discount rate, P is the
service life of the switch |
| The operation and maintenance cost of the switch is calculated based on the scale-coefficient and is given by |
 (6) (6) |
| Where n is the scale coefficient that operation and maintenance costs account for the investment |
| The customer Interruption cost can be calculated by using weighted average of average electricity price
conversion factor and ratio of output value to unit electric energy consumption and is given by |
 (7) (7) |
 (8) (8) |
| Where WENS is expected energy not supplied, |
| CC is economic loss of power units, α1 is weighting coefficient of average electricity price conversion factor, α2 is ratio
of output value unit electric energy consumption, K is the ratio of output value unit electric energy consumption b is
the ratio of unit price of electricity blackouts and average electricity price and d is average electricity price. |
| C. Calculation of Expected Energy not supplied (WENS): |
| The reliability of the system for switching configuration is different in which expected outage index WENS is considered
to evaluate the monetary value of reliability. In this work DG impact on the expected outage is considered.
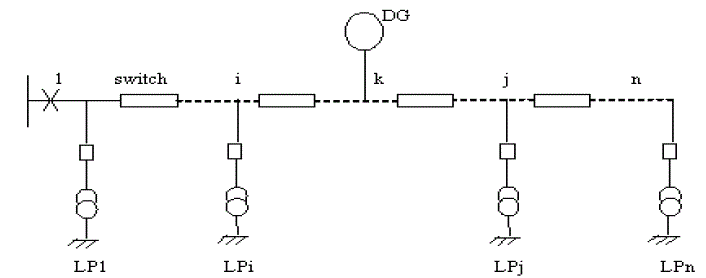
Consider a simple radial network as shown in figure. 1 which is consisting of n feeder sections. The left side of each
section is meant to install switches. Let a DG is placed on section k and all other sections are connected with load and
all the load branches are equipped with fuses. |
| For the above system the Expected Energy not supplied of load point „i‟ is given as |
 (9) (9) |
| Where tui is the expected outage time and is calculated based on the islanding probability of load point „i‟ |
 (10) (10) |
| Where tIs,i is the outage time of load point „i‟ when it is within the island that DG can form |
| tc,i is the outage time of load point „i‟ when it is not within the island |
| Pli is the total load connected to load point „i‟ |
| When the load point „i‟ is included in the island that DG can form its outage time tIs,i can be calculated as the
procedure given in [9]. |
| Calculation of Islanding Probability of load point „i‟ (IPLPi): |
| The islanding probability of a load point „i‟ is different for load points placed before and beyond the location of DG |
| IPLPi = IPBj,i.IPHj,i |
| Where IPBj,i is the probability that the load demand is smaller than the amount of DG output
IPHj,i is the probability that DG can supply full of its output and no failure encountered in the time
Interval “j” |
| above two probabilities‟ can be calculated as |
 (11) (11) |
 (12) (12) |
| Where P(PDG≥Gj) is the probability that the DG output is greater than the island load, P(NT) is the probability that
DG does not leave its state to a lower generation state, is the rate of transition to higher generation levels and is
the rate of transition to lower generation levels. After calculating the islanding probability of each time intervals by the
above procedure and substituted into equation (10) the desire outage time of each load point is calculated for each time
interval. If total time interval of 24 hours is divided into n time intervals then total desire outage time of each load
point is calculated from the following equation |
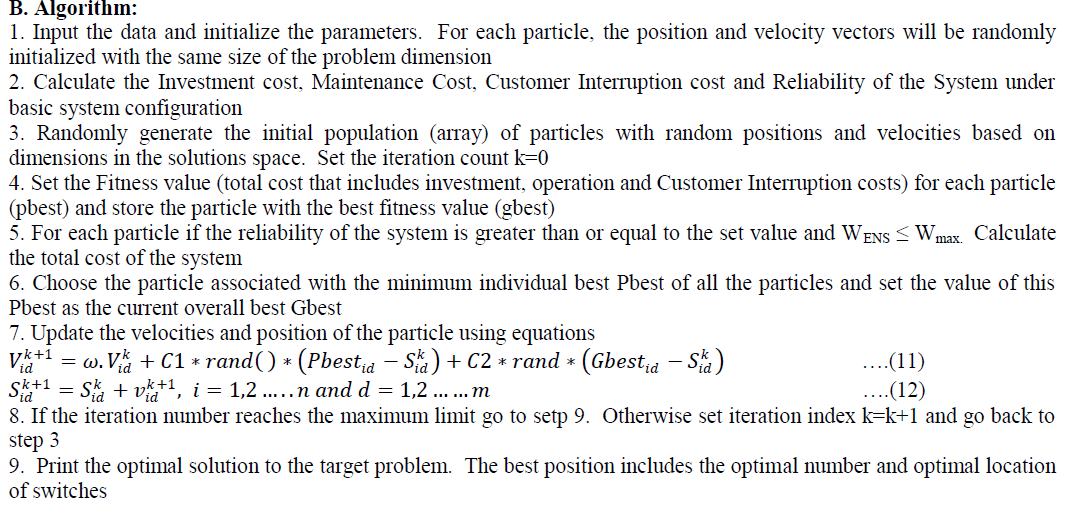
 |
| In the above Tui is the expected outage time of load point ‘i’ in the time interval Tj from equation (10) |
III. Computational Algorithm of PSO for Switches Optimization in DG equipped Distribution System |
| In this section, the procedure for solving the switches optimization problem using Particle Swarm
Optimization is presented to obtain the optimal number and its location of sectionalizing switches in a DG enhanced
distribution system. Here mainly the PSO was utilized to determine the number of sectionalizing switches and its
optimal location in a distribution system (in which already a DG is equipped) to minimize the total cost of the system
and at the same time to achieve the required degree of reliability. |
| The procedural steps used in the Switches Optimization Problem using PSO are given below: |
| A. Representation of individual Particle: |
| The existence of a switch at all candidate locations is set as a gene, and many genes constitute an individual.
Each individual within the population represents a candidate solution for the Switches Optimization problem. For example if n candidate locations are there to install switches in a distribution system in which the DG is installed at bus
„k‟ then the trial location vector will be |
| Xi = [n, x1, x2, x3……….., xn] for all candidate locations of DG |
| In the above n is the number of sectionalizing switches and x1, x2…….,xn are candidate locations of
sectionalizing switches |
 |
III. RESULTS AND ANALYSIS |
| The proposed optimal allocation of switches in a DG enhanced distribution system by PSO is tested on two
test systems viz., an IEEE 8 and IEEE 12 bus systems. The proposed algorithm has been implemented in MATLAB
7.0 version on Pentium IV, 2.4 GHZ Personnel Computer with 4 GB RAM. |
| At each test system, 100 trails were performed using the proposed method to observe the solution quality,
convergence characteristic, and execution time. The parameters used in PSO to get the optimal solution of the problem
are given in Table 1 |
| The optimal number of switches and their locations, the expected energy not supplied and the total cost of the
system with required value of the reliability is presented. It has been observed the solutions that were obtained by
using the Particle Swarm Optimization for the Optimal Switching locations problem, the number of switches to be used
in the system has reduced and hence total cost of the system has also decreases for the same level of reliability required |
| A. Example 1: |
| An IEEE-8 bus radial distribution system shown in figure 2, consisting of 8 buses or nodes and 7 lines is
considered here as test case and the DG is assumed to be located at bus 6. For this network there is a provision to
install 6 switches at x1, x2, x3, x4, x5 and x6. The line data and load data of the system has taken from [9]. The
optimum number of switches, their location and EENS is given in Table.2. |
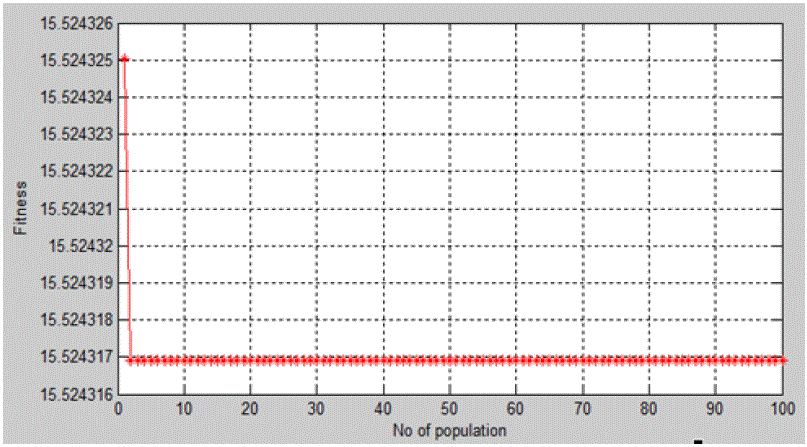
| From the results given in Table 2 it is observed that by applying the proposed PSO for switches optimization
problem the number of switches is reduced from 5 to 4, and the total cost of the system has reduced from 17.7520
Million Yuan to 15.52432 Million Yuan and the Expected Energy Not Supplied has been slightly increased from
12.1972 to 12.44625 for the same degree o f reliability of 99.988%. The convergence characteristic of PSO for the
IEEE-8 bus system is shown in figure 3. |
| B. Example 2: |
| An IEEE-12 bus radial distribution system shown in figure 4, consisting of 12 buses or nodes and 11 lines is
considered here as second test case and the DG is assumed to be located at bus 9. For this network there is a provision
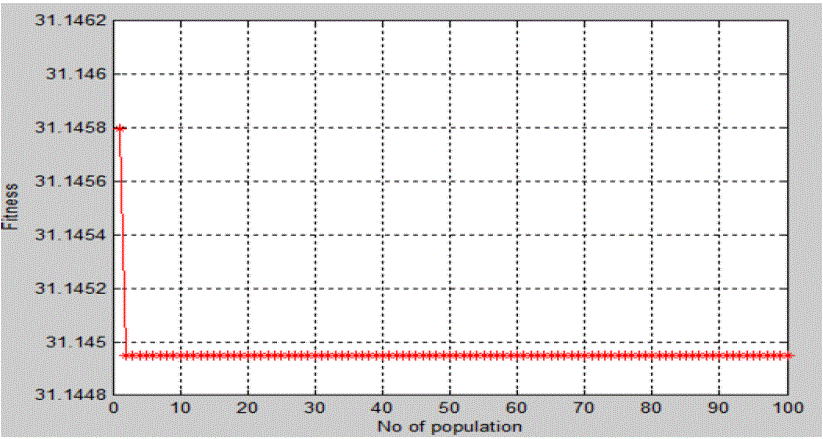
to install 11 switches at x1 to x11. The convergence characteristics of PSO for the IEEE-12 bus system is shown in
figure 5. The optimum number of switches, their location and EENS is given in Table.3. |
| From the results given in Table 3 it is observed that by applying the proposed PSO for switches optimization
problem the number of switches is reduced from 10 to 8, and the total cost of the system has reduced from 34.25478
Million Yuan to 31.14495 Million Yuan and the Expected Energy Not Supplied has been slightly increased from
10.89562 to 10.99125 for the same degree o f reliability of 99.988%. The convergence characteristic of PSO for the
IEEE-12 bus system is shown in figure 5. |
IV.CONCLUSIONS |
| A Particle Swarm Optimization for finding the Optimal number of switches and their location in distribution
systems with DGs is proposed and successfully tested on two test systems. From the results obtained it has been
observed that by placing the switches at their optimal locations the cost of the system has reduced considerably for the
same degree of reliability and the results obtained are compared with the existing other optimization technique GA and
it has proved that PSO can gives best results. |
Tables at a glance |
|
|
| |
Figures at a glance |
 |
 |
 |
 |
 |
| Figure 1 |
Figure 2 |
Figure 3 |
Figure 4 |
Figure 5 |
|
| |
References |
- Maurhogg, B.; Wood, G., “Dispersed generation-reduce power costs and improve service reliability,” IEEE rural Elecgtric Power Conference, pp.C5/1-C5/7,2000
- Silvestri, A,;Berizzi, A.; Buonanno, S., “Distributed generation planning using genetic algorithms,” IEEE Power Tech Budapest99, pp.257, 1999
- Dugan, R.C.; McDermott, T.E.; Ball, G.J., “Distribution planning for distributed generation,” IEEE Rural Electric power Conference, pp.C4/1- C4/7, 2000.
- Rackliffe, G., “Guidelines for planning distributed generation system,” IEEE PES Society summer meeting, Vol.3, pp. 1666-1667, 2000
- Ning Wu, Yang Xu, Yuping Lu, New Fault section location algorithm for Distribution Network with DG. Automation of Electric PowerSystems, 33(14); 77-82, 2009,
- Jingwei Zhang. Distributed power island new algorithm for distribution maintenance schedule. Chinese College Electric Power Systems and Automation Twenty fourth annual meeting Proceedings (next volume), 2730-2733, 2008
- Bollen MHJ, Sun Y, Ault G.W. Reliability of Distribution Networks with DER, 2005 International Conference on Future Power Systems, 1-6, 2005
- Pregelj, A, Begovic, M, Rohatgi, A. Recloser allocation for improved Reliability of DG-Enhanced Distribution Networks. IEEE Transactions on Power Systems, 21(3): 1442-1449 2006,
- Chai Weiwei, Wen Yafeng, Liu Wenxia, “Optimal Allocation of Switches in DG enhanced Distribution Systems, 978-1-4211-6255-1/11/2000
- Caihao Liang, XiezhongDuan. Distributed generation and its impacts on the power system. Power systems, (12), 53-56, 2001
- Ning Wu, Yang Xu, Yuping Lu. New Fault section Location Algorithm for Distribution Network with DG. Automation of Electric Power Systems, 33(14); 77-82, 2009
- Jingwei Zhang, Distributed power island new algorithm for distribution maintenance schedule. Chinese college Electric Power Systems and Automation Twenty fourth Annual meeting proceedings(next volume), 2730-2733
- BollenM.H.J,Sun Y, Ault G.W. Reliability of Distribution Networks with DER. 2005 International Conference on Future Power Systems, 1-6, 2005
- Pregelj, A. Begovic, M, Rohatgi, A Recloser Allocation for improved Reliability of DG-Enhanced Distribution Network. IEEE Transactions on Power Systems, 21(3); 1442-1449, 2006
|