Research & Reviews: Journal of Food and Dairy Technology
ISSN: 2321-6204
ISSN: 2321-6204
1College of Food and Dairy Technology, Chennai, India
2Department of Food science and Technology, CFDT, Chennai, India
3College of Food and Dairy Technology, TANUVAS, Chennai, India
Received Date: 24/10/2016; Accepted Date: 14/11/2016; Published Date: 20/11/2016
Visit for more related articles at Research & Reviews: Journal of Food and Dairy Technology
The aim of this study was to investigate the production of spray dried fish and algal oil with different wall materials. To improve consumption of omega-3 fatty acids, foods can be enriched with omega-3 rich oils. Microencapsulation of omega-3 oils minimizes oxidative deterioration and allows their use in stable and easy-to-handle form. Microencapsulation of omega-3 fatty acids can be achieved by using a variety of methods, with the two most commonly used commercial pro-cesses being Micro fluidization and spray dried emulsions. A variety of other methods are in development including spray chilling, extrusion coating and liposome entrapment. The key parameter in any of these processes is the selection of wall material. The Stable Omega-3 fatty acid emulsion prepared from fish oil (36%EPA, 24%DHA and 70% Total Omega-3) and algal oil (35% DHA, 1% EPA) was prepared. It can be concluded, that the production of fish oil and algal oil microcapsules by spray drying technique is possible, however its oxidative stability is improved.
Fish oil, Microencapsulation, Omega- 3PUFA, Oxidation, Spray drying
The beneficial effects of long chain omega-3 polyunsaturated fatty acids (LCn-3PUFAs), i.e., eicosapentaenoic and docosahexaenoicacids (EPA and DHA), on human health have been well documented [1]. Beneficial health effects of omega-3 LC PUFA intake are well demonstrated for prevention of cardiovascular diseases and cancer, as well as in the improvement of a proper development and functioning of the brain, retina and testis [2-4]. Dietary recommendations suggest that the consumption of omega-3 LC PUFA should be increased. The European Academy of Nutritional Sciences (EANS), as well as the UK Department of Health (1994) recommend a minimal average intake of 0.2 g omega-3 LC PUFA (EPA plus DHA) per person per day [5,6]. The Food and Drug Administration stated that daily intake of omega-3 LC PUFA should not exceed the upper limit of 3.0 g per person per day in the form of fish oil, from food and dietary supplements. For food fortification only unhydrogenated, well-refined and stabilized fish oil can be used. The hydrogenation process may improve stability and shelf life of fish oil; however, saturation of carbon-chain double bonds eliminates the desirable health properties of omega-3 PUFA [7-9]. Despite an elevation of omega-3 LC PUFA intake, fortification of food with fish oil may impact negatively on sensory quality. Unacceptable fish oil off-flavour and its susceptibility to oxidative deterioration, which additionally accelerates the off-flavour formation, limits the use of fish oil for food fortification [10-13]. Since they have high unsaturation degree, these fatty acids are very susceptible to oxidization. Therefore, food enrichment with those sources has an undesirable influence on shelf-life, consumer acceptability, functionality, and safety of enriched foods [14]. It has been demonstrated that microencapsulation protectsLCn-3PUFAs against oxidation [15]. Hence, the objective of this study was to optimize emulsions and encapsulation methods for the production of functional foods by adding fish/algal oil.
Materials
Purified fish oil containing omega-3 LCPUFA 30 n-3 food oil) was obtained as a grant from (trade name Himedia, India. The fish/algal oil in water emulsion ingredients such as 10% fish oil, algal oil, 95% pure whey protein concentrate, tocopherol (200ppm) (Himedia, India), BHT (200ppm) (Himedia, India) and squalene (0.5%, 1%, 1.5%) (Sigma Aldrich, India).
Emulsion Preparation
The fish/algal oil in water emulsion was prepared by using ingredients such as 10% fish oil, algal oil, 95% pure whey protein concentrate, tocopherol (200ppm),BHT (200ppm) and squalene (0.5%, 1%, 1.5%).10 g of whey protein was dissolved in 900ml of distilled water adjusted to the pH to 7. A pre-homogenisation was done for 3 min using an ultra turrax (IKA T18, Germany) by adding the oil mix slowly over 1 min and then mixing was continued for further 2 min. After the pre-homogenisation, the emulsion was prepared by using a micro fluidizer (Total pressure of 15000 PSI, Micro fluidics M-110P, Newton, MA) by passing three times. The sampling was done on 0, 12, 24, 48, 96, 120, 144 and 168 hours. Each sampling period one bottle was taken flushed with nitrogen and stored at -80°C until analyses.
Microencapsulation
The prepared emulsions were fish/algal oil with antioxidants in combinations transformed into microencapsulated powder using the table top spray drier equipped with an anti-blocking device operated under the influence of compressed air (to avoid the blockage during spray drying) (M/s.Basic Technologies Pvt. Ltd., Kolkata) under standard conditions. The emulsion was sprayed into the chamber at a pressure of 2 kg/cm2 (30 psi) through a one way nozzle (0.8 mm). The inlet and outlet temperature was maintained at 160°C and 70°C respectively. The microencapsulated powder (5 g) each was filled in brown plastic containers and stored in refrigerator for 7 days.
Droplet Size
The droplet or particle size (Z-average) of the emulsions were studied by using the Zeta sizer (Malvern Instruments, Zetasizer version 7.03, Crystal Growth Centre, Anna University, Chennai).
Microencapsulation Efficiency
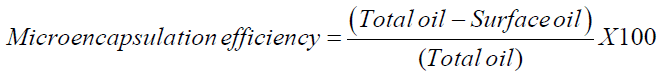
The microencapsules were studied for its microencapsulation efficiency to assure that the particles are well encapsulated. The encapsulation efficiency was studied by the method [16] by measuring surface oil content. After estimating the surface oil content and the total oil content, the microencapsulation efficiency was calculated using the following formula,
Micro structural Features of Microencapsulated Powder and Emulsion
The micro structural features of the microencapsulated powder and the emulsions were studied using Scanning electron microscopy (SEM) (SAIF, IIT Madras).
Powder Wettability
Wettability of the powders was determined by the method [17]. One gram of the powders was sprinkled over the surface 100 ml of distilled water at 20°C without agitation. The time taken for the powder particles to sediment or sink or submerse below and disappear from the surface of water were measured and used for a relative comparison of the extent of wettability between the samples.
Powder Bulk Density
Bulk density of the powders, which is defined as the weight of a given volume of powder, was determined according to the tapping method [18] with some modifications. Approximately 0.5 g of the powders was loosely placed into a 5 ml measuring cylinder. The cylinder was tapped on a flat surface by hand until a constant volume was obtained. The bulk density was calculated by dividing the sample weight by the volume and expressed in gcm-3.
Powder True Density
The tap density was measured by pouring 10 g of microencapsulated fish and algal oil powder into a 100 ml graduated measuring cylinder. The cylinder was tapped 300 times on a table. Tap density measurement was repeated 3 times for each sample [19].
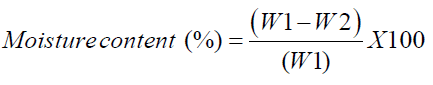
Moisture Content
The moisture content was determined by AOAC method [20]. An empty dish and the lid was dried in the oven at 105°C for 3 h and transferred to desiccator for cooling. About 3 g of sample to the dish was weighed and uniformly spreaded. The dish with sample was placed in the oven and dried for 3 hours at 105°C. After drying, the dish with partially covered lid was transferred to the desiccator for cooling. The following equation was used to calculate moisture content on wet basis,
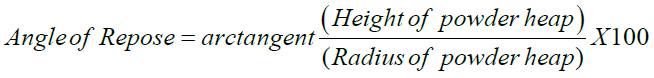
Free-Flowingness Measurement
Pouring out a heap of powder through a funnel stem ranked as the 10 cm height from the ground and measuring its angle of repose, α, determined the free-flowingness. Therefore, the cot α was an appropriate measure of free-flowingness, and was calculated from the ratio of powder heap radius to height according to the below equation.
Dispersibility Measurement
50 mL of PBS at pH 7.4 was mixed with 0.1 g of microencapsulated fish/algal oil powder. The mixture was stirred at 500 rpm for 10 min., and then 1 mL of the mixture was collected in a cuvette to measure the absorbance at 440 nm wavelength using a spectrophotometer (DU 730; Beckman Coulter) for 20 min.
Porosity
Porosity is the percentage of air between the particles compared to a unit volume of grains. It was calculated using the following equation [21].
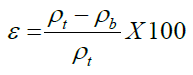
Where, ε - porosity ρ_t - true density (g/cc), ρ_b- bulk density (g/cc)
Characterization of Emulsions and Encapsules
Droplet size
The droplet size was measured for 10% fish/algal oil in water emulsions containing both 1% and 10% whey protein concentrates and was expressed as Z-average. The droplet size varied with the emulsions prepared with increasing amount of whey protein. For the fish oil emulsion prepared with 1% whey protein the droplet size (Z-average) was found to be 262.5 nm while for algal oil emulsion (1% whey protein) the droplet size was 240.9 nm.
The droplet size of the emulsions prepared with 10% whey protein were found to be 310.4 nm for Algal oil and 244.8 nm for Fish oil emulsion respectively and represented below. Droplet size measurement showed the presence of only one sigmoid curve in all type of emulsions studied indicating that the emulsions are physically stable and there is no phase separation (Figures 1 - 4).

Figure 1: Size distribution by intensity for algal oil emulsion prepared with 1% whey protein.

Figure 2: Size distribution by intensity for fish oil emulsion prepared with 1% whey protein.

Figure 3: Size distribution by intensity for algal oil emulsion prepared with 10% whey protein.

Figure 4: Size distribution by intensity for fish oil emulsion prepared with 10% whey protein.
Microencapsulation efficiency
The microencapsules were studied for its microencapsulation efficiency to assure that the particles are well encapsulated and to check for the leakage of oil on the surface of the particle. The efficiency was studied for all the produced encapsules including a commercial powder for comparison. The microencapsulation efficiency of the particles are given in the following Table 1.
Table 1. Microencapsulation efficiency of fish and algal oil microencapsulated powder.
| ENCAPSULES | FISH OIL | ALGAL OIL | ||||
|---|---|---|---|---|---|---|
| TO | SO | ME (%) | TO | SO | ME (%) | |
| ES0.5% | 0.8846 | 0.0759 | 87.9636 | 0.741467 | 0.0787 | 89.3904 |
| ES1% | 0.8836 | 0.0996 | 88.7114 | 0.747333 | 0.0795 | 89.3155 |
| ES1.5% | 0.8843 | 0.0844 | 89.8717 | 0.745033 | 0.0805 | 89.1966 |
| ET | 0.8892 | 0.0671 | 92.4044 | 0.7471 | 0.0782 | 89.4742 |
| EBHT | 0.8866 | 0.0759 | 91.4139 | 0.743967 | 0.0775 | 89.5818 |
| ES+T 0.5% | 0.8866 | 0.1826 | 91.1271 | 0.745067 | 0.0784 | 89.4559 |
| ES+T1% | 0.8862 | 0.078 | 90.9536 | 0.748967 | 0.0791 | 89.4262 |
| ES+T 1.5% | 0.8858 | 0.0836 | 90.5106 | 0.747167 | 0.0805 | 89.1926 |
| Control | 0.8830 | 0.076 | 91.4159 | 0.752333 | 0.0804 | 89.2092 |
| CP | 3.1040 | 0.2586 | 91.6696 | - | - | - |
Micro Structural Features of Microencapsulated Powder and Emulsion
In scanning electron microscope observed that the particle size of the microencapsulated powder differs within the same emulsion and encapsules. The particles showed the significant difference in the size with each other and not uniformly distributed. For fish oil encapsulate and emulsion the value ranged from 764 nm to 3.14 μm and 463.2 nm to 1.45 μm respectively. The particle size of the algal oil encapsulate and emulsions were found to be 537.8 nm to 5.79 μm and 458 nm to 1.58 μm respectively (Figure 5).

Figure 5: SEM images of the fish and algal oil microencapsulated powder.
Physical Characteristics of Emulsion and Powder
The physical characteristics results indicated that the microencapsulated powder produced is superior in quality in terms of moisture content, bulk density, porosity etc. (Table 2).
Table 2. Physical properties of fish and algal oil microencapsulated powder.
| MC (%) | Bulk Density | True density | Porosity | |||||||||||||
|---|---|---|---|---|---|---|---|---|---|---|---|---|---|---|---|---|
| Fish oil | Algal oil | Fish oil | Algal oil | Fish oil | Algal oil | Fish oil | Algal oil | |||||||||
| ES0.5% | 2.4453 | 2.4435 | 0.2467 | 0.2276 | 1.968 | 1.8092 | 88.0113 | 87.416 | ||||||||
| ES1% | 2.4335 | 2.5296 | 0.2083 | 0.1809 | 2.0729 | 1.715 | 89.9435 | 89.4477 | ||||||||
| ES1.5% | 2.4252 | 2.4311 | 0.2377 | 0.2189 | 1.8297 | 1.7676 | 87.0069 | 87.6159 | ||||||||
| ET | 2.4634 | 2.3623 | 0.2367 | 0.1809 | 2.0455 | 1.5599 | 87.7606 | 86.3926 | ||||||||
| EBHT | 2.4442 | 2.3811 | 0.2219 | 0.2122 | 2.3201 | 1.6568 | 90.4328 | 86.7558 | ||||||||
| ES +T 0.5% | 2.3665 | 2.2865 | 0.2276 | 0.2123 | 1.8952 | 1.9705 | 87.9889 | 89.9881 | ||||||||
| ES+T1% | 2.5882 | 2.4069 | 0.2621 | 0.1943 | 1.6429 | 1.5754 | 84.0418 | 87.7518 | ||||||||
| ES+ T 1.5% | 2.4737 | 2.3686 | 0.193 | 0.1869 | 2.0462 | 2.2314 | 90.5801 | 89.7651 | ||||||||
| Control | 2.4293 | 2.2024 | 0.2285 | 0.1869 | 1.856 | 2.0454 | 87.4471 | 91.4466 | ||||||||
| CP | 3.25 | 0.35 | 1.5533 | 77.4702 | ||||||||||||
| ME (%) | Wettability | Dispersibility | Free flowingness | |||||||||||||
| Fish oil | Algal oil | Fish oil | Algal oil | Fish oil | Algal oil | Fish oil | Algal oil | |||||||||
| gm | time | gm | time | |||||||||||||
| ES0.5% | 87.9636 | 89.3904 | 1.0059 | 11.25 | 1.0036 | 10.3 | 0.6373 | 0.654 | 1.5809 | 1.5941 | ||||||
| ES1% | 88.7113 | 89.3155 | 1.0254 | 11.48 | 1.0021 | 10.23 | 0.664 | 0.6656 | 1.6325 | 1.6920 | ||||||
| ES1.5% | 89.8717 | 89.1966 | 1.0288 | 10.32 | 1.269 | 11.38 | 0.6563 | 0.6453 | 1.5289 | 1.5973 | ||||||
| ET | 92.4044 | 89.4742 | 1.198 | 10.55 | 1.2508 | 11.55 | 0.6446 | 0.6736 | 1.5484 | 1.6498 | ||||||
| EBHT | 91.4139 | 89.5818 | 1.2571 | 10.71 | 1.2417 | 11.44 | 0.635 | 0.6533 | 1.6726 | 1.6560 | ||||||
| ES +T 0.5% | 91.1271 | 89.4559 | 1.0774 | 10.2 | 1.0206 | 10.34 | 0.624 | 0.6456 | 1.6663 | 1.7655 | ||||||
| ES+T1% | 90.9536 | 89.4262 | 1.0135 | 10.16 | 1.0124 | 10.31 | 0.6346 | 0.6543 | 1.6753 | 1.5689 | ||||||
| ES+ T 1.5% | 90.5106 | 89.1926 | 1.3173 | 11.62 | 1.1148 | 10.51 | 0.666 | 0.673 | 1.6465 | 1.5974 | ||||||
| Control | 91.4154 | 89.2092 | 1.0812 | 10.39 | 1.0066 | 10.37 | 0.6723 | 0.6676 | 1.5809 | 1.6408 | ||||||
| CP | 91.6696 | 1.1204 | 10.27 | 0.6223 | 1.5505 | |||||||||||