Index Terms
|
| Direct current (DC), Maximum power point tracking (MPPT), Photovoltaic (PV) Perturb and Observe (P&O). |
INTRODUCTION
|
| The growing demand coupled with the possibility of reduced supply of conventional fuels, evidenced by petroleum crisis, along with growing concerns about environment conservation, has driven research and development of alternative energy sources that are cleaner, renewable and produce little environmental impact. Among the alternative sources, the electric energy from photovoltaic (PV) cells is currently regarded as a natural energy source that is more useful. Since it is free, abundant, and clean and distributed over the earth and participates as a primary factor of all other process of energy production on earth. A great advantage of PV cells is the reduction of carbon dioxide emissions. The main drawbacks of PV systems are that the initial installation cost is considerably high and the energy conversion efficiency is relatively low. Therefore, the overall system cost could be reduced drastically by using highly efficient power conditioners, such as maximum |
| power point trackers to extract and maintain the peak power from the PV module even when unfavorable conditions occur. The conventional maximum power point tracking include hill climbing [2]. Perturb and observe (P&O) [4], incremental conductance [6]. The convergence speed of fuzzy logic and neural network schemes is fast. Detailed comparison of different maximum power point tracking techniques is discussed in [1]. DC load are preferred in this paper because the output from the PV is DC and it does not need a external inverter circuit and hence DC systems can be used for long transmission and distribution path. DC systems are better suited for energy storage, renewable and alternative power sources because almost all of them are inherently DC. False detection and clearance is also easy in case of DC circuits. No frequency or phase control problem is involved in DC. The advantage of DC is discussed in paper [3]. |
PHOTOVOLTAIC MODEL
|
| A. Basic PV cell |
| The basic structure of solar cells is a p-type semiconductor with a small quantity of boron atoms as the substrate. Phosphorous atoms are then added to the substrate using high-temperature diffusion method in order to form the p-n junction. In the p-n junction, holes and electrons will be rearranged to form a potential barrier in order to prevent the motion of electrical charges. When the p-n structure is irradiated by sunlight, the energy supplied by photons will excite the electrons in the structure to produce hole-electron pairs. These electrical charges are separated by the potential barrier at the p-n junction. The electrons will move towards the ntype semiconductor and the holes will move towards the p-type semiconductor at the same time. If the n-type and p-type semiconductors of a solar cell are connected with an external circuit at this moment, the electrons in the ntype semiconductor will move to the other side through the external circuit to combine with the holes in the ptype semiconductor. This shows how currents of the external circuit generate. Because the output voltage of a solar cell is extremely low (about 0.5–0.7V), solar cells will be connected in series and in parallel in practical applications. After connection, solar cells have to be strengthened by a supported substrate and covered by tempered glass in order to comprise the solar module. After this, solar modules can be connected in series and in parallel to create a solar array according to capacity demands. |
| B. Mathematical Modelling of PV cell |
| The equivalent circuit of the general model which consist of a photo current, a diode, a parallel resistor expressing a leakage current,isshowninfig1 |
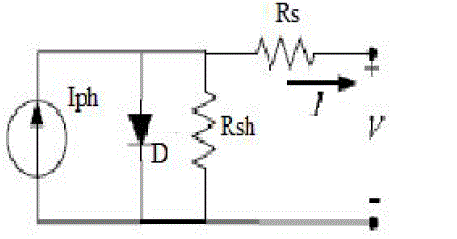 Fig. 1. Equivalent circuit of solar cell Fig. 1. Equivalent circuit of solar cell |
| PV panel modelling is done based on diode, current and voltage equations. |
| Current-input PV module |
Inputs:
|
| PV current IPV[A] |
| Insolation [W/m2] |
Outputs:
|
| PV voltage VPV [V] |
| PV output power Ppv [W] |
| Voltage input PV module |
Inputs:
|
| PV voltage VPV [V] |
| Insolation [W/m2] |
Outputs:
|
| PV current IPV[A] |
| PV output power Ppv [W] |
| C. PV cell circuit model and equations |
| Current equation |
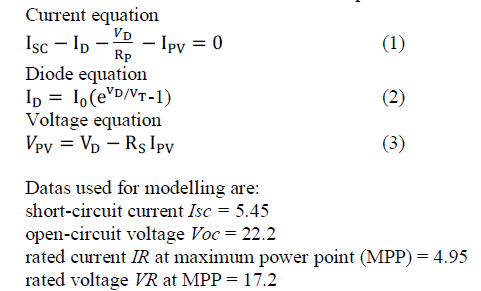 |
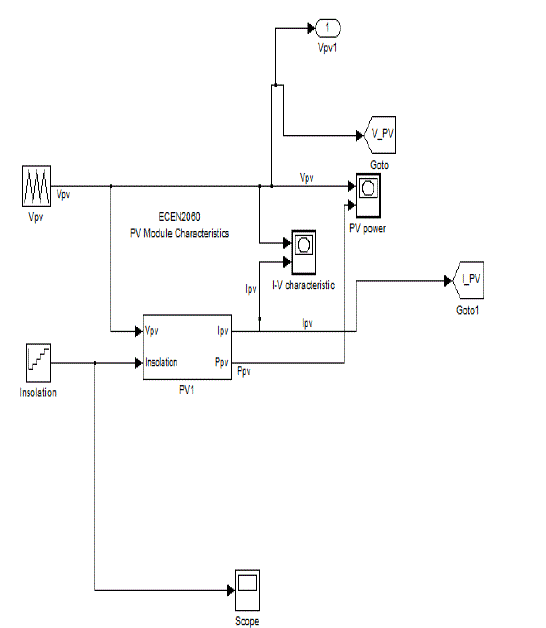
Fig..2 Simulation of PV panel |
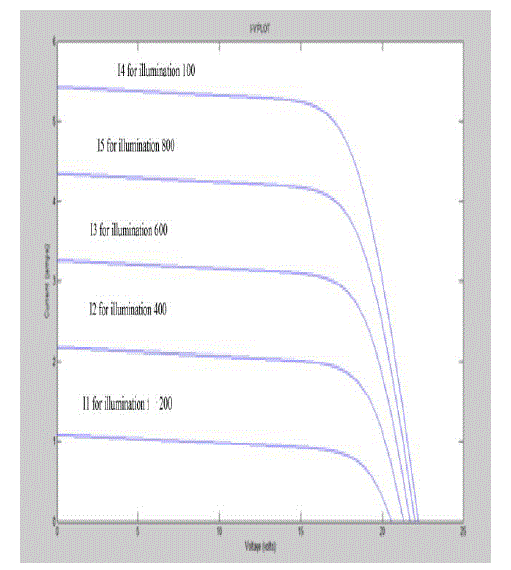
Fig.3. I-V characteristics of PV panel |
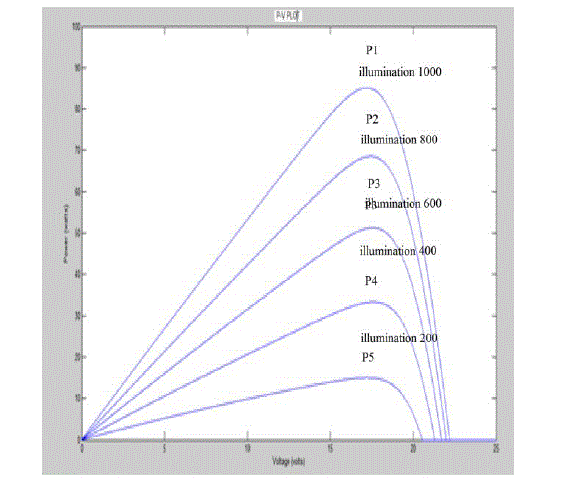
Fig.4 PV characteristics of PV panel |
MPPT TECHNIQUE
|
| The perturbation and observation method (P&O) |
| The P&O method is a widely used approach to MPPT. The values for panel voltage V and panel current I as its input values and the desired operating voltage Vref as its output value. This process works by perturbing the system by increasing or decreasing the array operating voltage and observing its impact on the array output power. |
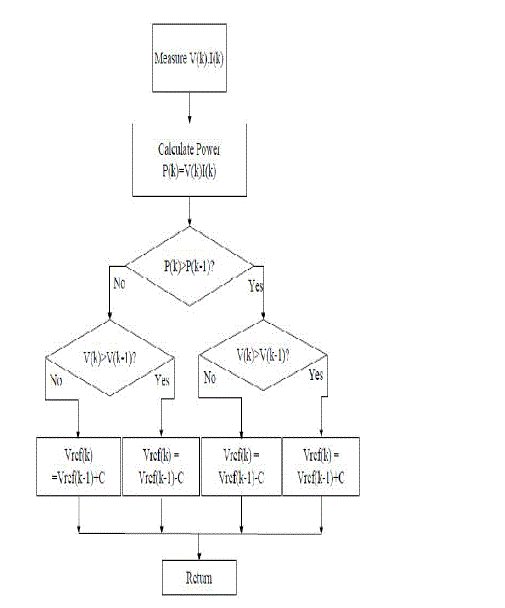
Fig 5 Flow chart of the P&O MPPT algorithm |
| Fig5 shows a flow chart diagram of the P&O algorithm. The values of V and I are trapped from the panel. V and I are measured to calculate the current array output power P(k). This value for P(k) is compared to the value obtained from last measurement P(k-1). If the output power has increased since the last measurement, the perturbation of the output voltage will continue in the same direction as in the last cycle. If the output power has decreased since the last measurement, the perturbation of the output voltage will be reversed to the opposite direction of the last cycle. With this algorithm the operating voltage V is perturbed with every MPPT cycle. As soon as the MPP is reached, V will oscillate around the ideal operating voltage Vmp. |
| This causes a power loss which depends on the step width of a single perturbation. If the step width is large, the MPPT algorithm will be responding quickly to sudden changes in operating conditions with increased losses under stable or slowly changing conditions. If the step width is very small the losses under stable or slowly changing conditions will be reduced, but the system will be only able to respond very slowly to rapid changes in temperature or insolation. The value for the ideal step width is system dependent and needs to be determined experimentally. |
| Another drawback of the P&O method is in case of a sudden increase in insolation, the P&O algorithm reacts as if the increase occurred as a result of the previous perturbation of the array operating voltage. The next perturbation, therefore, will be in the same direction as the previous one. And this will lead to an operating point far away from the actual MPP. This process continues until the increase in insolation slows down or ends. |
| An environment of rapidly changing atmospheric conditions and frequently changing insolation levels this deviation from the MPP can cause significant power loss. The technique is mostly involved because of its low cost and simplicity. |
PARALLEL &STANDALONE OPERATION
|
| Parallel Standalone operation of the panel is based upon the illumination of the panel. |
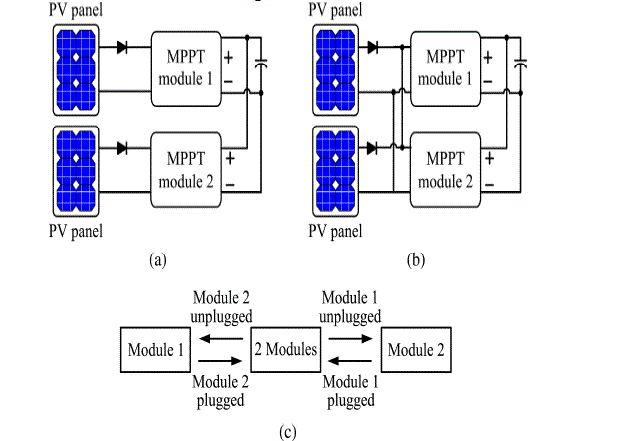
Fig.6. Connected configurations of the two MPPT (a) standalone; (b)
parallel;
(c) Possible configuration changing conditionsc |
| The possible connected configurations of the MPPTs are shown in Fig 6. In the standalone configuration, the MPPTs may operate in different modes due to different solar illumination. In the parallel configuration, the input voltages of the MPPTs will be very close. The determination of online PV-string configurations is based on this phenomenon. However, the input voltages of the MPPTs may be close in standalone mode due to their similarity of the solar illumination. First, the input voltages of the MPPTs are checked. If the input voltage of the MPPT is higher than the threshold voltage i.e. 2V, this MPPT will be labeled as standalone and vice versa. If two input voltages of both MPPTs are very close (within 1 V), the connecting configuration will be detected as to be the parallel mode. On the contrary, the connecting configuration labeled as standalone mode. Parallel operation improves efficiency of operation of the panel [5]. In parallel operation current balancing is also done, if the difference of current is greater than threshold current duty cycle of that panel is increased else decreased. This is done so that the panel with greater illumination will generate more voltage and current. |
SIMULATION RESULTS
|
| The simulation is done using MATLAB software. The input voltage and insolation of the panel are made slight different based on the condition check standalone and` parallel are done. The entire circuit diagram is shown as below |
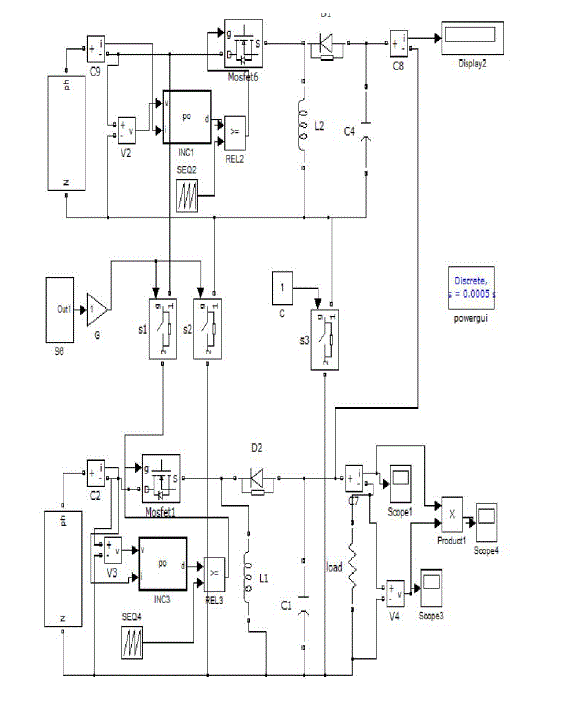
Fig. 7. Simulation of Standalone and Parallel operation.
|
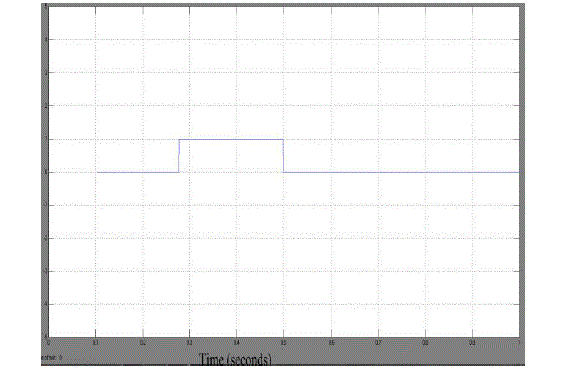
Fig 8.Output based on insolation condition (string check). |
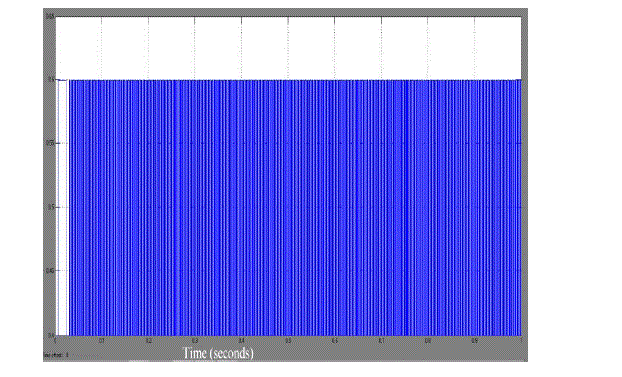
Fig 9.Output from P&O technique |
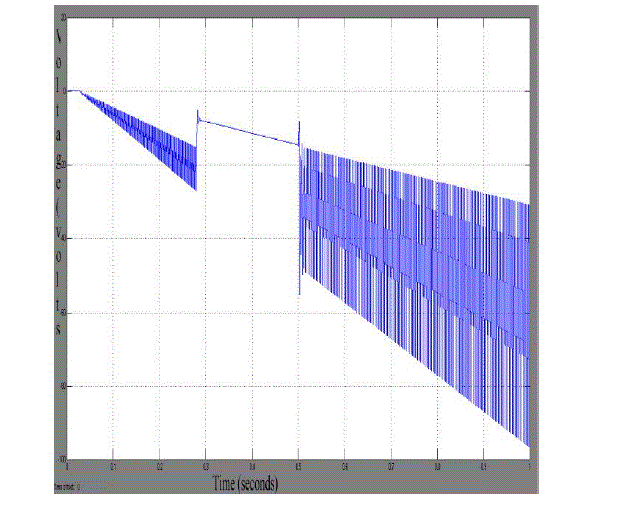
Fig 10.Output voltage waveform |
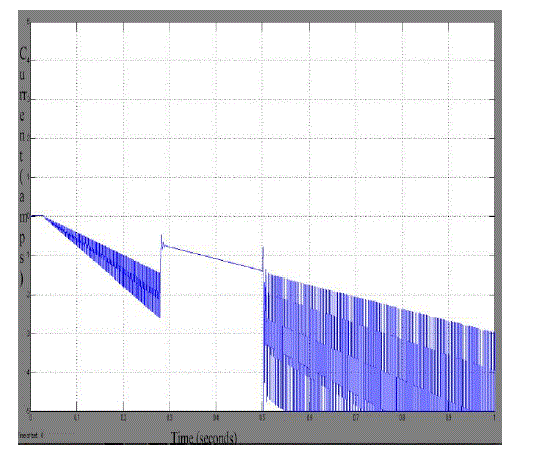
Fig 11.Output current waveform. |
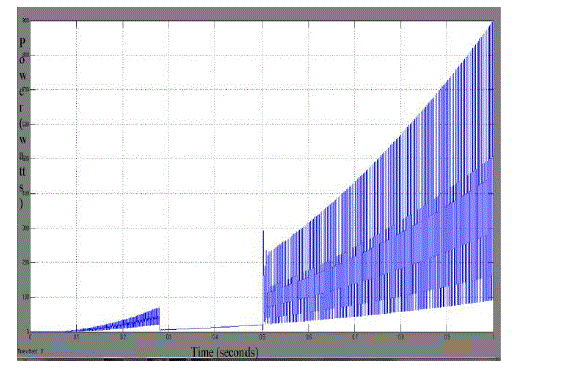
Fig 12.Output power waveform. |
| Fig 10, 11 & 12 are the outputs of voltage, current and power of the generated simulated module. During parallel operation of the panel’s power generated and provided to the load is more. The advantage of parallel operation is that even when one of the converters fails power is provided to the load from both the panels through the other converter. This is not possible in standalone operation. In standalone operation the current and power generated by the module is less. Online configuration check checks the voltage difference between the two panels if the voltage difference is less than the threshold value then the two panels are operated under parallel condition and if the voltage difference is higher than the threshold voltage value then the panels are operated in series. |
CONCULSION
|
| The parallel and standalone condition based on the insolation condition is achieved in this paper, string configuration check is done online. Current value increases during parallel operation and decreases during standalone operation. Maximum power is tracked using Perturb and Observe method and simulation results are verified. |
References
|
- T. Esram and P. L.Chapman, “Comparison of photovoltaicarraymaximumpower point tracking techniques,” IEEE Trans. EnergyConvers., vol. 22,no. 2, pp. 439–449, Jun. 2007.
- A. K. Abdelsalam, A. M. Massoud, S. Ahmed, and P. N. Enjeti,“High-performance adaptive perturb and observe MPPT technique forphotovoltaic-based microgrids,” IEEE Trans. Power Electron., vol. 26,no. 4, pp. 1010–1021, Apr. 2011.
- M. E. Baran and N. R. Mahajan, “DC distribution for industrialsystems: Opportunities and challenges,” IEEE Trans. Ind. Appl., vol.39,s no. 6, pp. 1596–1601, Nov./Dec. 2003.
- N. Femia, G. Petrone, G. Spagnuolo, and M. Vitelli, “Optimization ofperturb and observe maximum power point tracking method,” IEEETrans. Power Electron., vol. 20, no. 4, pp. 963–973, Jul. 2005.
- L.-J. Gao, R. A. Dougal, S.-Y. Liu, and R. A. Iotova, “Parallelconnectednsolar PV system to address partial andrapidly fluctuating shadow conditions,”IEEE Trans. Ind. Electron., vol.n56, no. 5, pp. 1548–1556, May 2009.
- A. Safari and S. Mekhilef, “Simulation and hardware implementationof incremental conductance MPPT with direct control method usingCuk converter,” IEEE Trans. Ind. Electron., vol. 58, no. 4, pp. 1154–1161,2011.
|