Keywords
|
| Image fusion, Brovey method, DWT, Entropy, RMSE, PSNR. |
INTRODUCTION
|
| Remote sensing offers a wide variety of image data with different characteristics in terms of temporal, spatial, radiometric and Spectral resolutions. For optical sensor systems, imaging systems somehow offer a trade off between high spatial and high spectral resolution, and no single system offers both. Hence, in the remote sensing community, an image with „greater qualityâÃâ¬ÃŸ often means higher spatial or higher spectral resolution, which can only be obtained by more advanced sensors . The designing of a sensor to provide both high spatial and spectral resolutions is limited by the trade off between spectral resolution, spatial resolution, and signal-to-noise ratio of sensor. It is, therefore, necessary and very useful to be able to merge images with higher spectral information and higher spatial information [1]. |
| Image fusion techniques can be classified into three categories depending on the stage at which fusion takes place; it is often divided into three levels, namely: pixel level, feature level and decision level of representation [2,3]. Many methods have been proposed for image fusion based on HIS transform, PCA transform and neural network approach. Among such methods, Multiplicative Transform, BROVEY transform and Wavelet based transform can quickly merge huge number of satellite images of high spatial resolution. Thus, in this paper, multiplicative transform, Brovey transform and wavelet transform methods are developed to merge LANDSAT MS image with LANDSAT PAN image. |
MULTIPLICATIVE METHOD
|
| The Multiplication model combines two data sets by multiplying each pixel in each band of the MS data by the corresponding pixel of the Pan data. [2]. |
| The multiplicative method is derived from the four component technique. Crippen argued that of the four possible arithmetic methods only the multiplication is unlikely to distort the colors by transforming an intensity image into a panchromatic image Therefore this algorithm is a simple multiplication of each multispectral band with the panchromatic image |
| Red = (Low Resolution Band1 * High Resolution Band1) |
| Green = (Low Resolution Band2 * High Resolution Band2 ) |
| Blue = (Low Resolution Band3 * High Resolution Band3) |
| The advantage of the algorithm is that it is straightforward and simple. By multiplying the same information into all bands. However, it creates spectral bands of a higher correlation which means that it does alter the spectral characteristics of the original image data. |
BROVEY METHOD
|
| The BT, established and promoted by an American scientist, Brovey, is also called the color normalization transform because it involves a red-green-blue (RGB) color transform method. The Brovey transformation was developed to avoid the disadvantages of the multiplicative method. It is a simple method for combining data from different sensors. It is a combination of arithmetic operations and normalizes the spectral bands before they are multiplied with the panchromatic image. It retains the corresponding spectral feature of each pixel, and transforms all the luminance information into a panchromatic image of high resolution[3]. |
| The formulae used for the Brovey transform can be described as follows |
| Red = (band1/Σ band n)∗ High Resolution Band |
| Green = (band2/Σ band n)∗ High Resolution Band |
| Blue = (band3/Σ band n)∗ High Resolution Band |
| High resolution band = PAN [4]. |
DISCRETE WAVELET TRANSFORM: FIRST APPROACH
|
| Wavelet transform is a mathematical tool developed in the field of signal processing. The wavelet transform decomposes the signal based on elementary functions: the wavelets. By using this, a digital image is decomposed into a set of multi resolution images with wavelet coefficients. For each level, the coefficients contain spatial differences between two successive resolution levels. |
 |
| As shown in block diagram PAN image is decomposed using DWT. The image wil get divided into four component namely approximation, digonal, vertical and horizontal. Out of this four component approximation component carries maximum information. Now this approximation component is replaced by MS image[5]. |
| Processing steps of wavelet based image fusion |
| 1- Decompose a high resolution P image into a set of low resolution P images with wavelet coefficients for each level. |
| 2- Replace a low resolution P images with a MS band at the same spatial resolution level. |
| 3- Perform a reverse wavelet transform to convert the decomposed and replaced P set back to the original P resolution level. |
| For the processing the replacement and reverse transform does three times, each for one spectral band. |
DISCRETE WAVELET TRANSFORM: SECOND APPROACH
|
| This is the second approach for wavelet based image fusion. In this method second level DWT of PAN & of MS image is taken. Then LL component in second level decomposition of MS image is replaced by the PAN image. By doing this minute details are obtained and hence there are more chances of obtaining better quality image[6]. |
 |
| Processing steps of wavelet based image fusion : |
| 1- Decompose a high resolution P image into a set of low resolution P images with wavelet coefficients for each level. |
| 2- - Decompose a low resolution MS image into a set of low resolution MS images with wavelet coefficients for each level |
| 3- Replace a low resolution MS images with LL component of a PAN image a MS band . |
| 4- Perform a reverse wavelet transform to convert the decomposed and replaced P set back to the original P resolution level. |
EVALUATION PARAMETERS AND METHODS
|
| In order to verify preservation of spectral characteristics and the improvement of spatial resolution, fused images are visually compared. The visual appearance may be subjective and depends on human interpreter. Along with visual analysis a number of statistical evaluation methods are applied to fuse image. This statistical methods gives idea about color preservation and spatial improvement. We make use of following methods: |
A. Entropy
|
| Entropy is defined as amount of information contained in a signal. Shannon was the first person to introduce entropy to quantify the information. The entropy of the image can be evaluated as |
 |
| Entropy can directly reflect the average information content of an image. The maximum value of entropy can be produced when each gray level of the whole range has the same frequency. If entropy of fused image is higher than parent image then it indicates that the fused image contains more information. |
B.Standard deviation
|
| This metric is more efficient in the absence of noise. It measures the contrast in the fused image. An image with high contrast would have a high standard deviation. |
 |
| Where hI f (i) is the normalized histogram of the fused image If (x,y) and L is number of frequency bins in histogram. |
C.Root mean square error (RMSE)
|
| A commonly used reference-based assessment metric is the root mean square error (RMSE) which is defined as follows: |
 |
| where R(m,n) and F(m,n) are reference and fused images, respectively, and M and N are image dimensions. |
D.Pick signal to noise ratio
|
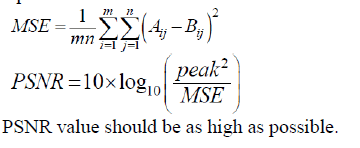
| PSNR computes the peak signal-to-noise ratio, in decibels, between two images. This ratio is used as a quality measurement between the original and a reconstructed image. The higher the PSNR, the better is the quality of the reconstructed image. To compute the PSNR, first we have to compute the mean squared error (MSE) using the following equation: |
 |
RESULTS AND ANALYSIS
|
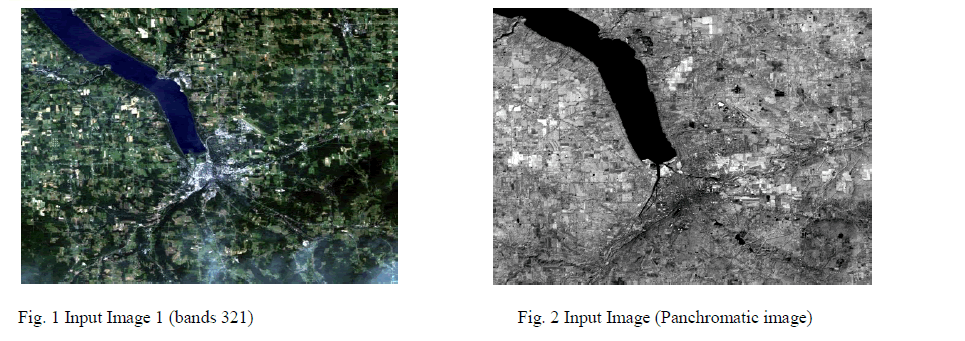
| In our experiments two images are used to verify our result, first image is MS image taken by Landsat 7 ETM+ channel called as ITHAC as shown in fig1. This image is consist of 7 bands and 1000 no of columns and rows. Second image is false color image. Fig 3 shows PAN image of the same place taken by Landsat 7 ETM+ channel satellite.PAN image is consist of only 1 band. |
| In order to fully utilize spectral information of former and geometric information of latter, image fusion algorithm is applied. In addition to visual analysis, we conducted a quantitative analysis. In order to assess the quality of the fused images in terms of Entropy, Standard deviation, RMSE and PSNR. |
 |
 |
| Input images :- |
| Following data is used in this study. |
 |
| Fig. 1 and Fig. 2 shows the input images used for experiment. Fig. 1 is MS image whereas the Fig.2 is PAN image. This images are taken by LANDSAT satellite. And this images are from same scene. |
| Output |
| Following are output images of various methods. |
 |
| Fig 3 and fig 4 shows result Average method and Multiplicative method. We can see that images are well fused and will be easily giving more information from original image. |
 |
 |
| Fig.7 DWT2 method |
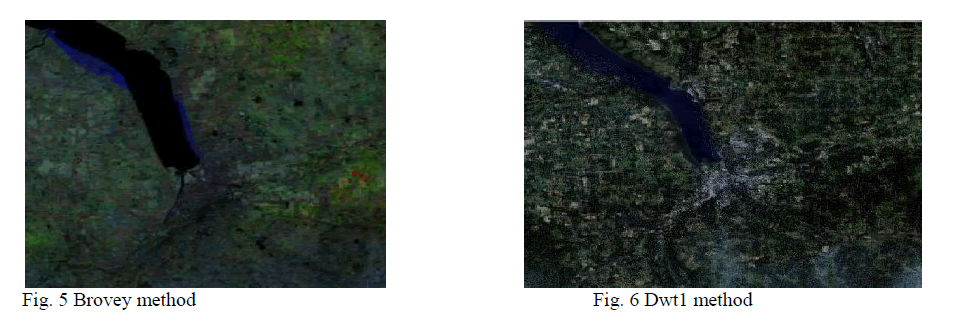
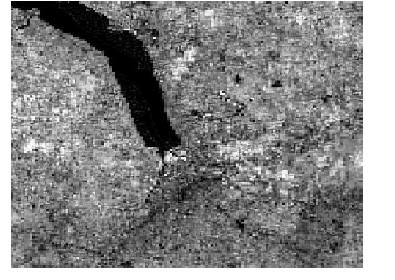
| Fig 5, Fig 6 and Fig 7 shows the result of Brovey, DWT1, DWT2 respectively. It is clear that in DWT2 we are getting color distortion. |
CONCLUSION
|
| In this paper five different methods like average method, multiplicative method, Brovey method and wavelet based methods are studied and compared with the help of assessment parameters. From table 1 it is clear that entropy of images merged by multiplicative methods or by wavelet based methods is higher than that of original image. This clearly indicates information content of fuse image is greater than that of original image. Also this table indicates averaging method contains more contrast. From visual point of view averaging method and Brovey method shows some color distortion. so in terms of both quality and quantity, information contain by mathematical and wavelet method is increase. |
References
|
- C Pohl, J van Genderen, “Multisensor Image Fusion of remotely sensed data: concepts, methods and applications”, International Journal RemoteSensing vol19(5) march 2009
- S.S.Hana, b, *, H.T.Lia, H.Y. Gua, b, “The Study On Image Fusion For High Spatial Resolution Remote Senscing Images”, The International Archivesof the Photogrammetry, Remote Sensing and Spatial Information Sciences. Vol. XXXVII. Part B7. Beijing , april2008
- Ningyu Zhang*a, QuanyuanWub, “Effects of Brovey Transform and Wavelet Transform on the Information Capacity of SPOT-5 Imagery”,International Symposium on Photoelectronic Detection and Imaging 2007 Proc. of SPIE Vol. 6623 66230W-1, June 2007
- SaschaKlonus, Manfred Ehlers, “Performance of evaluation methods in image fusion”, 12th International Conference on Information Fusion Seattle,WA, USA, July 6-9, 2009.
- V.P.S. Naidu and J.R. Raol,” Pixel-level Image Fusion using Wavelets and Principal Component Analysis” , Defence Science Journal, Vol. 58, No. 3,pp. 338-352, India., , May 2008.
|