ISSN ONLINE(2278-8875) PRINT (2320-3765)
ISSN ONLINE(2278-8875) PRINT (2320-3765)
S. Ravindra1, V. C. Veera Reddy2, S. Sivanagaraju3
|
| Related article at Pubmed, Scholar Google |
Visit for more related articles at International Journal of Advanced Research in Electrical, Electronics and Instrumentation Engineering
Now a day because of the continuous increase in power demand on a power system increases the importance of the power system severity analysis for secured operation. The contingency in a power system may be because of the outage of transmission lines or the generators. Out of which, generator outage condition is the most critical one. In this paper, the power system severity is analyzed under generator outage condition. The most sensitive generator(s) in a given system is identified using generator shift factors. The complete methodology of the proposed methodology to analyze the power system severity in terms of transmission line loadings and bus voltage magnitudes is analyzed on standard IEEE-14 bus test system with supporting numerical and graphical results.
Keywords |
| Power system security, Generator shift factors, Contingency analysis, Generator outage condition. |
I.INTRODUCTION |
| The necessity of power system security is due to the continuous change in the system operating conditions. In this, the voltage stability measurement in power system is one of the important issues. It is measured by on line monitoring of power system based using measurements like voltages, active power and reactive power etc. As the present power system is an interconnected network, when a generator is lost, the lost generation should be picked up by the other generator, due to which some of the transmission lines get overloaded and some of the generators are operating at its maximum limits. In general, the lost generation may be picked up by the slack generator and this leads to increase of power flow in transmission lines connected to this bus. |
II.LITERATURE SURVEY |
| In [1], the author uses QV curve analysis to investigate the voltage instability performance of risk-based securityconstrained optimal power flow (RB-SCOPF), where risk is modelled to capture the system’s overall security level, which is an improvement of SCOPF. In [2], they proposed a security risk analysis model (SRAM) to identify the relationship among uncertainty of vulnerability propagation, analyze the complexity and risk factors. In [3], they proposed an Islanding Security Region (ISR) concept to provide security assessment of island operation. In [4], they investigate the potential benefits to improve voltage security and prevent possible blackouts, making more efficient usage of system resources provided by demand-side management programs applied in power system congested areas. In [5], they proposed Robust Power System Security (RS) method of analysing the N-I security under the circumstances of PV penetration. |
| In [6], they propose a new approach for structural vulnerability analysis of power system networks, in which a DC power flow model with hidden failures is embedded into the traditional error and attack tolerance methodology to form a new scheme for power grids vulnerability assessment and modeling. This method embodies some important characteristics of power system networks. In [7], they investigate the vulnerability of power grid networks subject to hateful attacks according to a new framework. In [8], they discuss the draw backs of a pure topological approach. This fails the power system applications by capture the engineering features. So the improved topological method obtain by incorporating several of specific features of power systems such as electrical distance, power transfer distribution factors and line flow limits. |
| In [9], they use graph theory methods for analysis of physical performance of power grids even when cascade failure occurs, then estimate transmission network vulnerability from above models. This work investigates the structural vulnerability by means of comparisons between load flow models and scale-free graph statistic indexes, generating conclusions on the appropriateness of graph theory techniques for assessment of electric network vulnerability. In [10], they proposed vulnerabilities of the electric power grid and associated communication network, in the face of intermittent power generation and uncertain demand within a complex network framework of analysis of smart grids. In [11], they proposed a computational intelligence algorithm for analysis of power system in an open source environment. |
| In [12], they proposed mathematical models for the simulation of transmission line and generator outages and transformer outages so as to carry out a full AC load flow based contingency analysis and ranking. Also they discuss the importance of contingency Analysis. It is useful both in the network design stages and for network expansion works to detect network weaknesses. The weaknesses can be strengthened by transmission capacity increase, transformers rating increase besides circuit breakers ratings increase. In [13], they proposed an ordinal optimization based method for identify top contributors to power systems failure when considering cascade failure events. It helps for a better understanding to system stakeholders, provide internal and external situational awareness to operators, and help as a diagnostic support tool. |
| Congestion occurs due to various reasons such as generator outages, transmission line outages, changes in energy demand and uncoordinated transactions [14]. Demand side based Congestion management approach has presented in [15] to manage transmission line congestion for pool based electricity market model. Congestion management (CM) is one of the most important and challenging tasks of the Independent System Operator (ISO) in the deregulated environment. In [16], they proposed a new congestion management framework considering dynamic voltage stability boundary of power system. In this work exact dynamic modelling of power system equipment, including Loads and generators, is incorporated into the proposed congestion management framework. The presented method alleviates congestion with a lower congestion management cost and more dynamic voltage stability margin. |
| From the literature, it is identified that, generator outage condition is most severe when compared to the transmission line outage condition. In this paper, the most sensitive generator is identified based on the generator shift factors. A complete methodology is presented to analyse the system severity under contingency conditions. The proposed methodology is tested on standard IEEE-14 bust test system with supporting numerical results. |
III. POWER SYSTEM SEVERITY |
| While operating power system, it is necessary to consider a factor which relates to the system security and involves the design of the system to maintain the system security under various contingencies. In common practice, outage of a transmission line or a generator increases the loading on some of the transmission lines and deviation of voltage magnitudes at load buses may be violate either minimum or maximum limits. It is necessary to minimize the system severity and analyze the system condition to enhance the system security. For this purpose, in this paper, generator shift factor is defined to identify the most sensitivity generators for a given system. |
| The system severity should be evaluated for one of the severe conditions such as contingency condition. The result of this analysis allows the system to be operated securely. Now a day, because of the modernization of the power system with the help of computers, it is possible to identify the most critical transmission lines and generator that causes the system to be operates in an uncontrolled manner and leads cascading outages and failures. From this, it is necessary to perform a contingency analysis to predetermine the system effectiveness before they arise. |
A) GENERATOR SHIFT FACTOR |
| There are numerous methods in literature to analyze security of a given power system in terms of power flows and bus voltage magnitudes when a contingency occurs. The recent studies concentrate in finding the effect of generators active power generation on power flow in interconnected transmission lines. There are some of the linear sensitivity factors which are formulated to show the approximate variation of power flow in lines for a change in generation. Based on this, the generation shift factor for a line ‘l’ with the effect of generation at bus-i can be expressed as [12, 14] |
 |
| From this analysis, it can be identified that, the shift of generation at a generator affects the governor action on other generating units in an interconnected system. In this paper, the effect of generation change at each of the generators is calculated in each of the transmission lines using generation shift factors and power flows given in Eqn’s (1) and (2) respectively. Finally, the generation shift of a generator which has highest impact on power flows can be identified as the most sensitive one. |
IV.ALGORITHM FOR SEVERITY ANALYSIS UNDER GENERATOR OUTAGE CONDITION |
| It is necessary to predetermine the most sensitive generators for a given system to analyze the system security. To suggest and to take the protective corrections against contingency conditions, it is necessary to analyze the system severity under contingency conditions. For this purpose, in this paper, top 15% of the generator outages are considered to form contingency condition. |
| To identify the severity of generators outage on system security, the steps needs to be followed are: |
| Step 1: Read the system line and bus data. |
| Step 2: Perform load flow analysis using Newton-Raphson method. |
| Step 3: Obtain voltage magnitudes at all load buses and voltage angles at all buses except slack bus. |
| Step 4: Calculate power flows in each of the transmission lines. |
| Step 5: Change one of the generators generation from initial value to shift value i.e. the generation variation by 20MW (i.e. ΔPG=20MW). |
| Step 6: At this generation shift, calculate the new power flows in all lines using Eqn (2). |
| Step 7: Calculate the GSF for each of the transmission lines using Eqn (1) and also calculate the average of all GSF’s. |
| Step 8: Repeat the steps from 5 to 7 for all generators other than slack generator. |
| Step 9: Finally, identify the generator which has highest average value of the GSF’s and treat it as the most sensitive generator. |
| Step 10: Remove the top 15% sensitive generators from a given system to create contingency condition. |
| Step 11: Repeat the steps from 2 to 4 to identify the over loaded lines and voltage violated buses to analyze the system security. |
V.RESULTS AND ANALYSIS |
| IEEE-14 bus system with twenty transmission lines, five generators, three tap-changing transformers and one shunt compensator is considered. To analyze the security of a given system, the proposed methodology is tested on standard IEEE-14 bus test system with supporting numerical and graphical results. The proposed methodology is tested for the following case: |
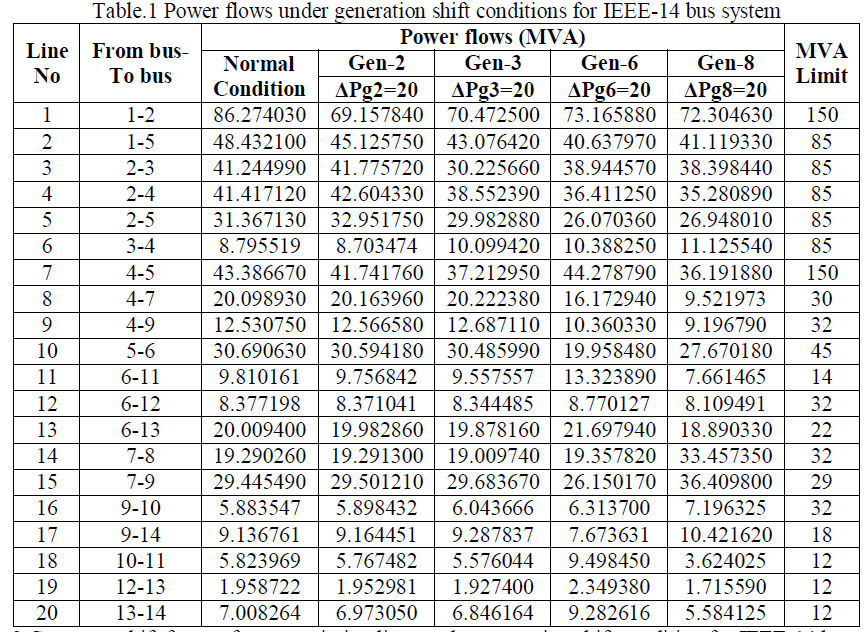
| Identifying sensitive generator using GSF values and outage of top 15% average GSF valued generators to create generator contingency condition. For this system, to calculate GSF value for each of the generators, the procedure given in section-2 is followed. Here, GSF value for generator-1 is not calculated as it is slack generator. Hence, for this system GSF values for four generators out of five are evaluated. To identify the most sensitive generator in a given system and to analyze the system security under generator outage condition, the procedure given in section-3 is followed. From this, the generation shift is applied to the generators at buses 2, 3, 6 and 8. Here, the power flow in transmission lines under normal and generation shift conditions are tabulated in Table.1. From this table, it is identified that, generation shift at bus-8 overloads the line-15 more severely, as it is nearer to it, when compared to generation shift at other generators. |
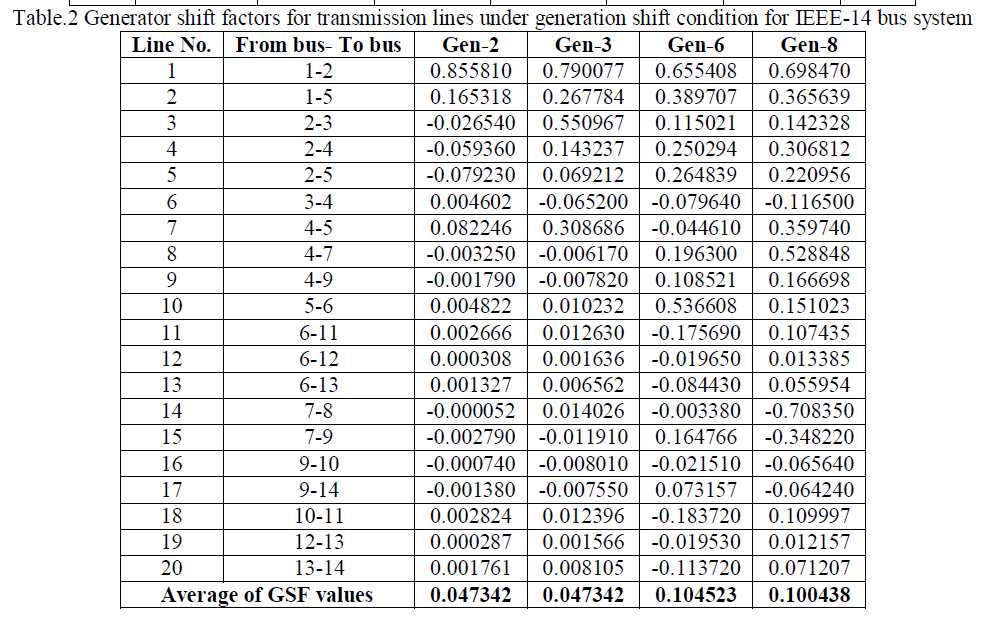
| The GSF values in each of the transmission lines are calculated using Eqn (1) are tabulated in Table.2. From this table, it is identified that, the average of GSF values is high for generator at bus-3, this implies, the generation shift at this bus effects the power flow in most of the transmission lines when compared to the power flow under normal condition. Here, the top 15% average GSF valued generators i.e. generator-3 is removed from the system to create contingency condition. |
 |
 |
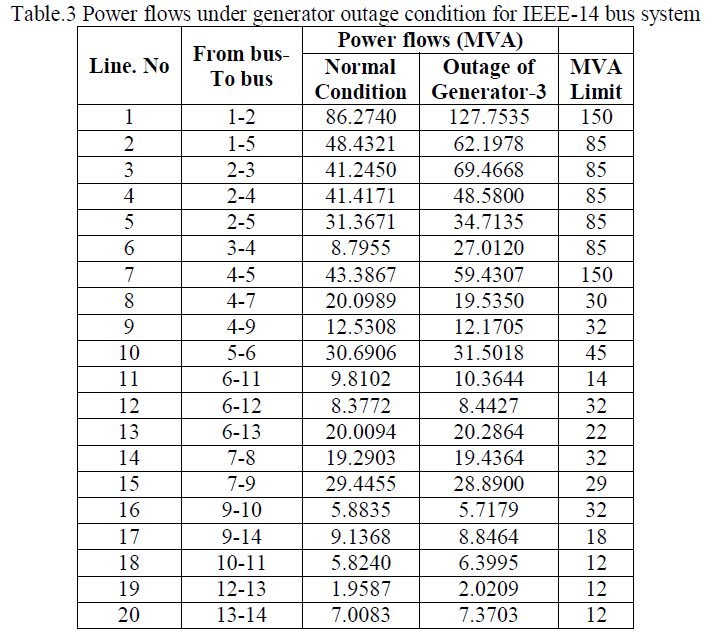
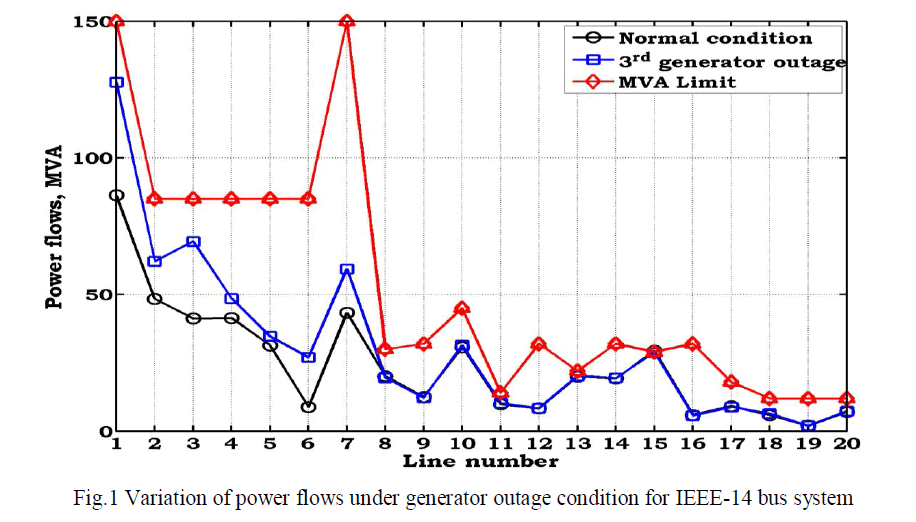
| To show the effect of generator-3 contingency condition, the power flow in lines under contingency are tabulated in Table.3. From this table, it is identified that, lack of generation at bus-3 compensated by the slack generator. Due to which, the power flow in line-1 is increased by 41.4795 MW when compared to normal condition. Similarly, to meet the load at bus-3, the power flow in lines 3 and 6 is increased by 28.2213 MW and 18.2165 MW when compared to normal condition. The respective variation of power flows is shown in Fig.1. |
 |
 |
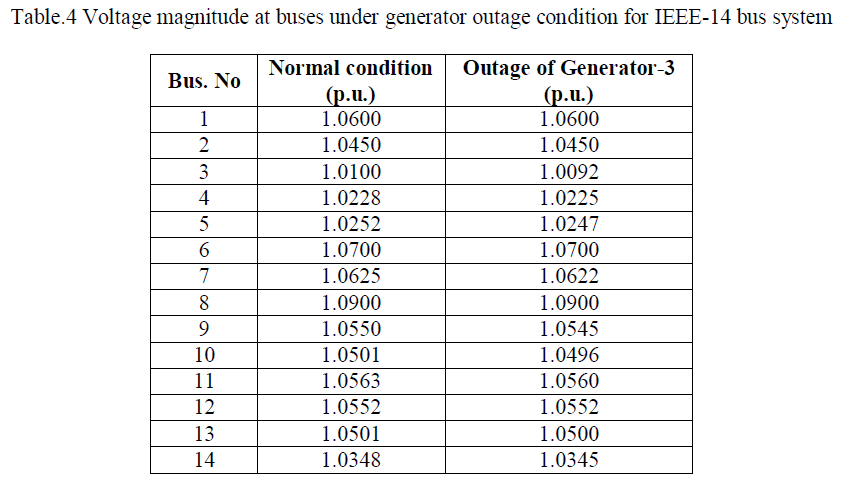
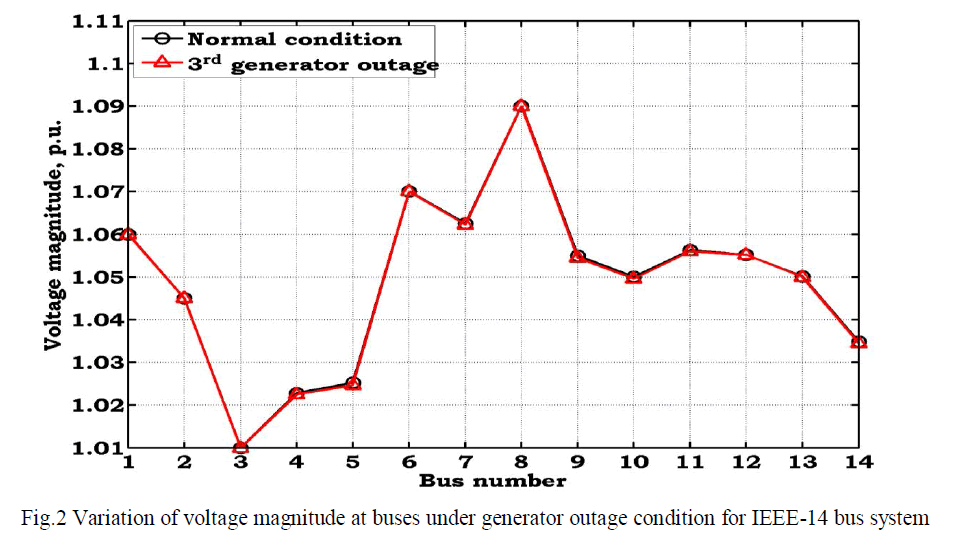
| Voltage magnitude at buses under generator contingency condition is tabulated in Table.4. From this table, it is identified that, outage of generator effects the bus voltages. From this table, it is identified that, bus-3 is no longer a generator bus under contingency condition, and also, the voltage magnitude at this bus is decreased when compared to normal condition. The variation of voltage magnitude at buses under contingency condition is shown in Fig.2. |
 |
 |
VI.CONCLUSION |
| In this paper, the power system security has been analyzed under generator contingency conditions. At first, the most sensitive generator(s) has been identified using GSF values. The top 15% sensitive generators are removed from the given system to create single event contingency condition. The power system severity has been analyzed in terms of power flow in transmission lines and voltage magnitude variation at buses under contingency condition. From the analytical results, it has been identified that, outage of generator has more effect on transmission lines when compared to the voltage magnitudes at buses. The proposed methodology has been tested on standard IEEE-14 bus test system with supporting numerical and graphical results. |
References |
|