ISSN ONLINE(2278-8875) PRINT (2320-3765)
ISSN ONLINE(2278-8875) PRINT (2320-3765)
M. Sridhar 1, K. Padma Raju2, Ch. Srinivasa Rao3, D. Venkata Ratnam1
|
| Related article at Pubmed, Scholar Google |
Visit for more related articles at International Journal of Advanced Research in Electrical, Electronics and Instrumentation Engineering
Rain attenuation is one of the important impairments that affects RF signal at Ku and Ka band frequencies. The forecasting of the rainfall and rain attenuation plays a vital role in the fields of communications, agriculture, military services, etc. The paper shows the results of experimentally measured rain attenuation of earthspace link in Kondapalli operating at 11.07 GHz. Auto-Regressive Integrated Moving Average (ARIMA) model is used to predict and generate the time series values for rain attenuation over a long period. The predicted values obtained using ARIMA model is compared with measured values of rain attenuation for different set of parameters of the model and analysis is done in terms of prediction error which could be used for the validation of the method.
Keywords |
| Rain attenuation, ARIMA model, ITU-R model, Time series, ccdf. |
INTRODUCTION |
| Satellite communication systems operating at and above Ku band frequencies must overcome the problem of propagation impairments which includes fading due to rain, clouds, snow, gases, and amplitude scintillations, for obtaining the required performance. Among all impairments, rain is the predominant factor that affects the signal most and the mechanism involved is absorption and scattering of the signal energy. The estimation of attenuation on the slant path to a satellite is essential to the process of establishing a margin in the link budget that ensures the required availability of the link is met [1]. |
| Several attenuation models have been developed that have been widely used like Crane model [2], the simple attenuation model (SAM), International Telecommunication Union Radio Communication sector model (ITU-R) [3], Dissanayake, Allnutt and Haidara model (DAH) [4], Moupfouma model [5], Excell model, etc. ITU-R uses a semi empirical approach for predicting rain attenuation and is one of the widely accepted models worldwide. |
| Number of models have been proposed and developed for prediction and generation of time series data of rain attenuation based on auto-regressive moving average processes [6]. A homogeneous non-stationary time series can be reduced to a stationary time series by taking a proper degree of differencing. Auto-regressive integrated moving average (ARIMA) model is used to model non-stationary events and form an important part of the Box- Jenkins approach to time-series modeling [7]. The paper mainly deals with ARIMA modeling of rain induced attenuation based on the available data at low latitude tropical station and generation of time series based on the model. |
A. ITU-R Rain Attenuation Prediction Model |
| Rain attenuation is the significant propagation impairment at Ku and Ka band frequencies. In ITU-R rain attenuation prediction model, the rain intensity at 0.01% probability level is the rain related input to the model. The model has been derived on the basis of the log-normal distribution where both point rain intensity and path attenuation distributions conform to the log-normal distribution. The model is applicable across the frequency range 4 to 35 GHz and percentage probability range 0.001% to 10%. |
| The input parameters to this model are: point rainfall rate for 0.01% of an average year (in mm/hr) with 1-min integration time, altitude of the location above mean sea level (in Km), elevation angle of the receiver (in degrees), latitude of the location (in degrees), frequency (in GHz), polarization angle (in degrees), and effective radius of the Earth (in Km) [8]. The rainfall rate exceeded for a given probability of the average year is obtained using and attenuation is calculated using ITU-R P. 837-5 Rain rate model. The rain attenuation exceeding 0.01% of an average year is calculated using Recommendations of ITU-R P. 618-9 as |
 |
| where R is specific attenuation in dB/Km and LE is effective path length in Km. |
B. ARIMA Model |
| Auto-regressive integrated moving average (ARIMA) models are the most general class of models for predicting a time series which can be stationarized by transformations such as differencing and logging. In ARIMA (p, d, q) model, the parameters p, d and q denote the orders of the AR part, the differencing process and the MA, respectively [9]. An ARIMA model predicts a value in a response time series as a linear combination of its own previous values, previous errors, and current and past values of other time series. For determining suitable ARIMA (p, d, q) model parameters, Box-Jenkins procedure is used for evaluating the stationarity in both variance and mean of the event [10]. |
| A process Zt is said to follow the integral ARMA model, which is referred to as ARIMA (p, d, q), if it can be written as |
| where d is a nonnegative integer, Zt is rain attenuation, at is the error, and B is the backward shift operator [7]. The stationary AR operator |
 |
| and the inevitable MA operator |
 |
| when d >1, 0 is called the deterministic trend term, and is often omitted from the model unless it is really needed [11]. The details of Box-Jenkins procedure can be obtained from [7]. |
EXPERIMENTAL SETUP |
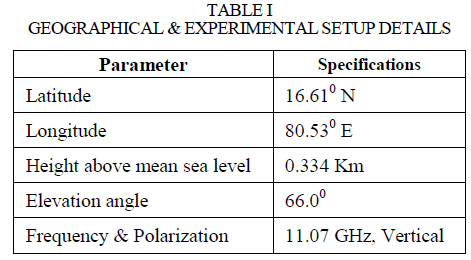
| The experimental setup is available at Kondapalli which is located in Vijayawada, Andhra Pradesh, India at an altitude of 0.334 Km above sea level and is one of the low latitude stations. India is a tropical region based on its climatic conditions. The details of the experimental setup and geographical conditions are shown in Table 1. The dish antenna will receive the signals from INSAT 4B satellite (93.50 E) operating at 11.07 GHz with Vertical polarization. The satellite signal strength of Ku band receiver is measured and stored in dB using a data logging equipment for every one minute interval. The rainfall rate (mm/hr) is obtained by using the rainfall data from Indian Meteorological Department website. The measured values of the rainfall rate and signal strength are considered for 3 days during 08.03.2013 to 10.03.2013. |
 |
RESULT ANALYSIS |
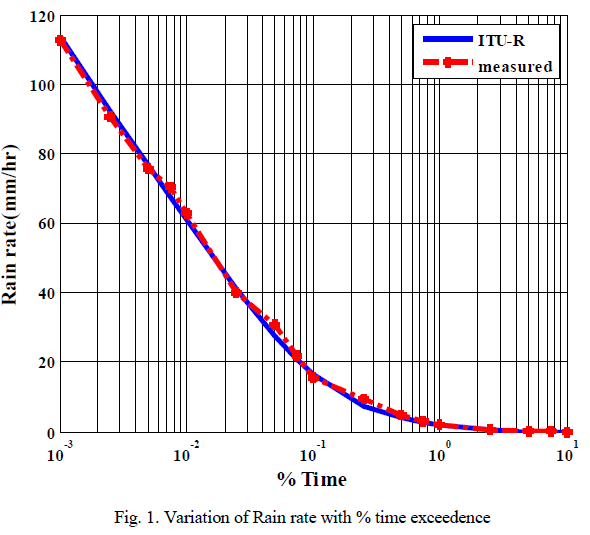
| The long-term behavior of a parameter is described by a complementary cumulative distributive function (ccdf) in efficient manner. The ccdf is commonly referred to as an exceedence curve which gives the percentage of time that the parameter exceeds a given value [1]. The rainfall rate in Kondapalli region is estimated using ITU-R 837-5 recommendation and compared with the measured values as shown in Fig. 1 [12]. It has been observed that the rainfall rate obtained at the 0.01% point is 60 mm/hr theoretically and 62 mm/hr practically. |
 |
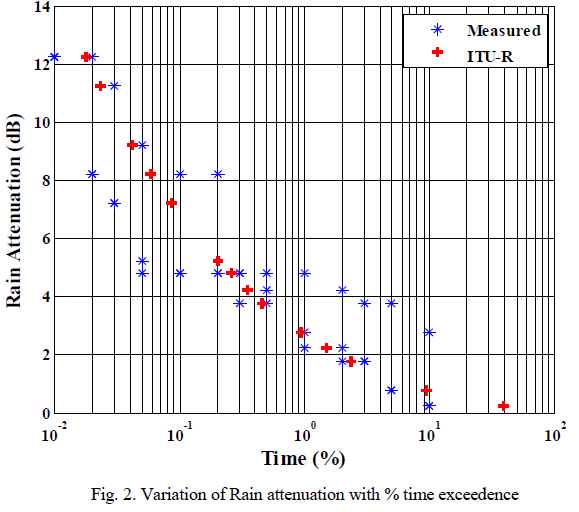
| Rain induced attenuation is calculated using ITU-R model which uses semi empirical approach to the prediction of rain attenuation. Rather than attempt to predict attenuation by inputting rainfall rate at every time percentage, it inputs only the rainfall rate measured for 0.01% of a year. It then extrapolates from this time percentage to other time percentages [13]. The predicted rain attenuation is compared with the actual measured level at 11.07 GHz frequency as shown in Fig. 2. From the figure, the attenuation is 12.2 dB and 12.3 dB, obtained theoretically and experimentally respectively, at 0.01% exceedence point. |
 |
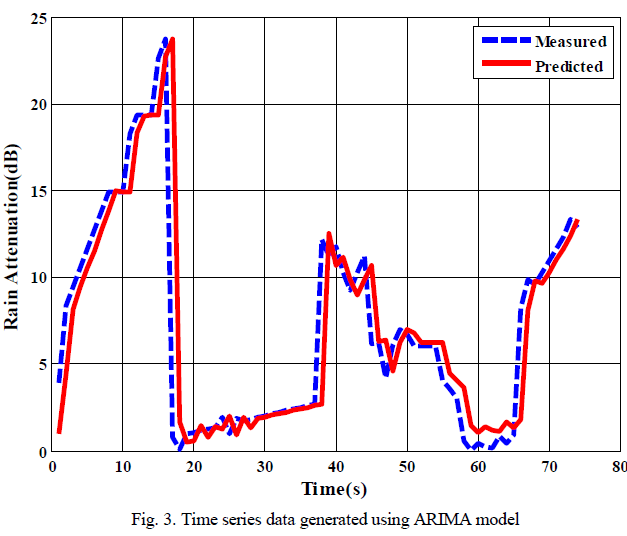
| ARIMA model is used to predict and generate the time series of rain attenuation for a given set of parameters. 100 samples out of 240 samples of the events occurred between 8th March to 10th March, 2013 are used for training purpose and subsequently forecasted time series is generated for next values as shown in Fig. 3. |
 |
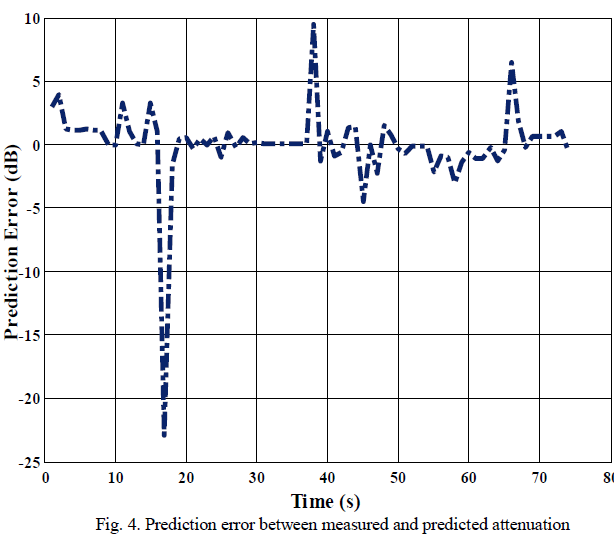
| By varying (p, d, q) parameters of the model, it has been observed that the events happened are more approached with ARIMA (1, 0, 1) [11]. The predicted rain attenuation is compared with original measurements and evaluated in terms of prediction error as shown in Fig. 4 [10]. It can be seen that most of the predicted events are closely followed with the measured events and the maximum prediction error of -23 dB is achieved. The prediction accuracy of the ARIMA model can be improved with more data from various stations. Investigations will be carried out in future. |
 |
CONCLUSIONS |
| In this paper, the results of rain attenuation measurement during 08.03.2013 to 10.03.2013 are presented and compared with ITU-R model results. Also, the time series data is generated using ARIMA model and compared with the measured values and analyzed in terms of prediction error. More data from different stations would be used for implementing rain attenuation prediction models. The morphology of rain attenuation would be investigated in future work. |
ACKNOWLEDGEMENTS |
| The above work has been carried out under the project entitled “Development of Ionospheric Forecasting models for Satellite based Navigation Systems over low latitude stations” sponsored by Department of Science and Technology, New Delhi, India, vide sanction letter No: SR/FTP/ETA- 0029/2012, dated: 08.05.12. The authors are thankful to P. Kalee Prasad, Doordarshan Kendra, Vijayawada for his valuable suggestions and help. |
References |
|