ISSN ONLINE(2319-8753)PRINT(2347-6710)
ISSN ONLINE(2319-8753)PRINT(2347-6710)
N. Biswas1, J. De2, R. S. Sen3, B. Oraon3, G. Majumdar3
|
| Related article at Pubmed, Scholar Google |
Visit for more related articles at International Journal of Innovative Research in Science, Engineering and Technology
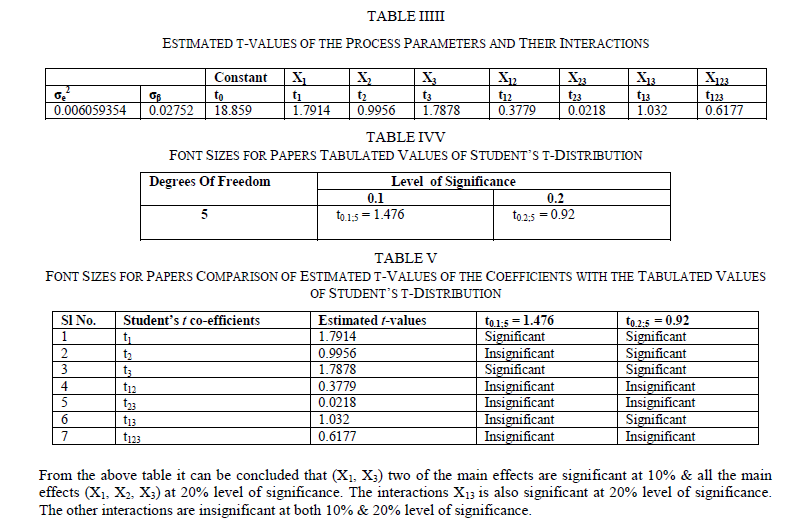
Ni-Cu-P coating was deposited on 99.99% pure Copper substrate electrolessly. The central composite design of experiment has been considered as the statistical analysis tool. The variation in surface roughness is studied by varying three parameters Ni-ion concentration, Cu-ion concentration and reducing agent concentration of the chemical bath. The surface roughness is considered as the response in student‟s t test and it has been observed that the Ni –ion source and Cu-ion source significantly influence the surface roughness at 10% level of significance. Also all the main effects (Ni-ion source, Cu-ion source, reducing ion source) and the interaction of Ni-ion and reducing agent, significantly influence the surface roughness at 20% level of significance. A mathematical model has developed considering second order response surface methodology which further considers the main effects as well as the effects of interaction and the effects of curvatures.
Keywords |
| StudentâÃâ¬ÃŸs t test, Electroless Ni-Cu-P coating, RSM, CCD |
INTRODUCTION |
| The term “Surface Roughness” refers to the deviation or undulation of a surface from a mean level on a given length of the surface. The surface roughness of electroless Ni-Cu-P coating is a very important property, as it determines the resistance to corrosion, predicts the wear phenomenon and determines the friction properties which helps to find the micro-hardness values of the coating-substrate combinations. The electroless bath typically consists of an aqueous solution of metal ions, reducing agents, complexing agents and stabilizers operating in a special ion concentration, temperature and pH ranges [12]. The basic chemical reactions for the electroless plating are as follows [12]: |
 |
| Though copper have good mechanical properties and high thermal conductivity but oxidation and wear is a major problem in copper which can be solved by Ni-Cu-P coating without changing the bulk property of the substrate. |
II. EXPERIMENTAL DETAILS |
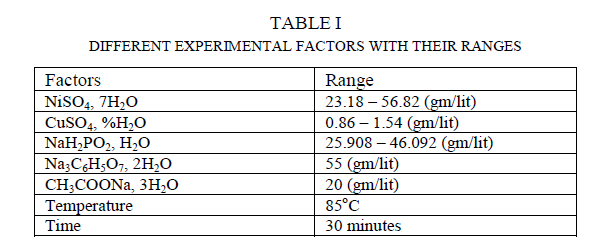
| In this present work electroless Ni-Cu-P coating has been deposited on 20 × 15 × 0.1 ïÿýïÿýïÿýïÿý3 99.99% pure Copper samples by Electrolessly. The samples are cut from 99.99% pure Copper strips and first rinsed in distilled water for cleaning and then the samples are acid pickled in dilute HCL. Then again they are rinsed in distilled water. Then the samples are kept to dry. The electroless bath comprised of the following chemical as shown in table 1. The bath is alkaline. |
 |
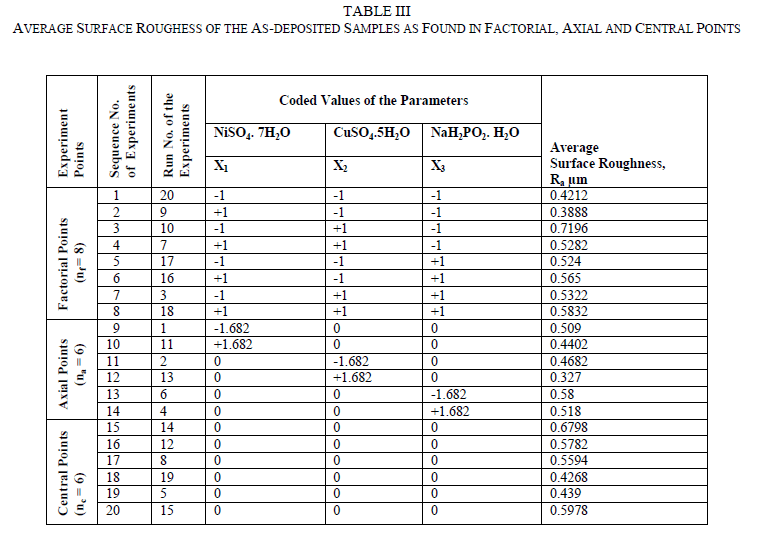
| After the deposition of coating for 30 mins the samples are rinsed in distilled water and then properly dried. Then The surface roughness measurements are done by TalySurf machine by Taylor Hobson Precision Instrument Surtronic 3+. Both Horizontal Magnification (around 100) and Vertical Magnification (around 10000) are done by the instrument accordingly. The surface roughness measurements are taken over a standard sample-length of 25 mm. |
 |
 |
 |
III. STATISTICAL ANALYSIS |
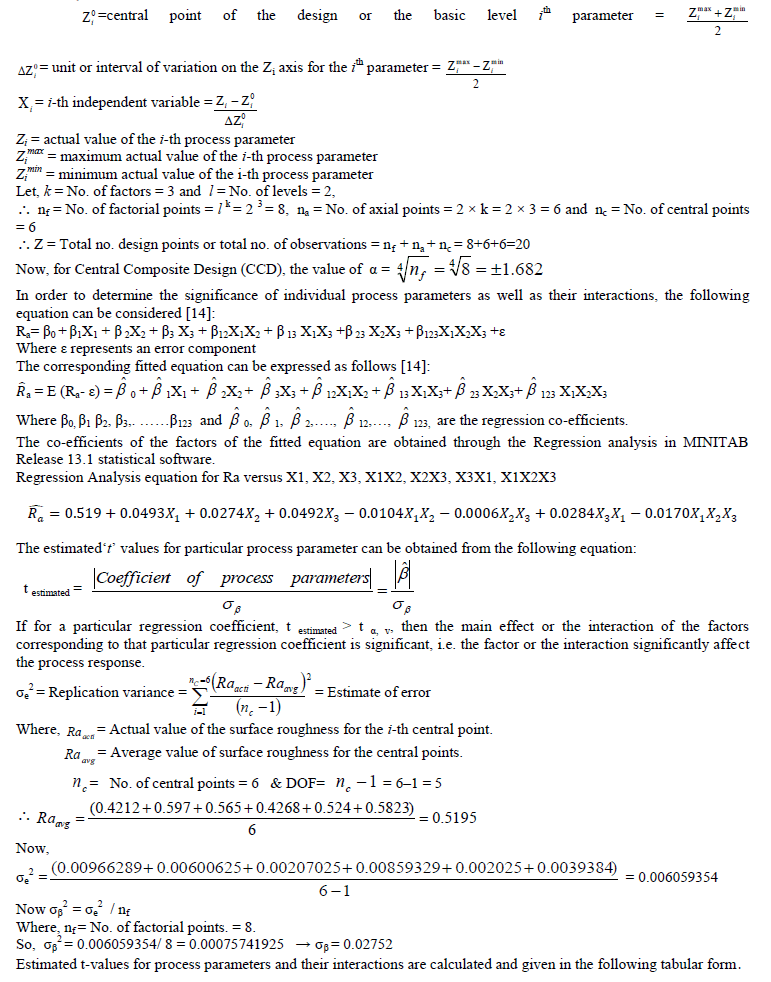
| The Central Composite Design (CCD) is used for modelling a second-order response surface, A CCD consists of lk factorial or fractional factorial points, nf (usually coded ±1 rotation), 2k axial points [(±a,0,0, . . ., 0), (0,±a, 0, . . ., 0), (0, 0,±a, . . ., 0), . . ., (0, 0, . . .,±a)] and nc central points [(0, 0, 0,. . ., 0)] and central points, nc (to make CCD orthogonal or uniform precision design). The uniform precision design means that the variance of the response at origin is equal to the variance of the response at a unit distance from the origin. A uniform precision design ensures more protection against bias in the coefficients than an orthogonal design. A CCD can be made rotatable by selecting the appropriate value of α and for a rotatable CCD, α =± nf 4 . Therefore, |
 |
 |
IV. MATHEMATICAL MODEL FOR SECOND ORDER RESPONSE SURFACE |
| Response Surface Methodology (RSM) consists of statistical and mathematical techniques which are useful for developing, improving, and optimizing processes. The most extensive applications of RSM can be found in situations when several input variables potentially influence some performance measure or quality characteristic of a process. Thus performance measure or quality characteristic is called the response. This input variables are independent variables. Response Surface method develops a model that describes a continuous surface which connects the measured data taken at strategically important places in the experimental window. It also models the effects of parameters at different levels. RSM uses a least square curve-fit to develop a mathematical model tests its validity and analyze the developed model. RSM has the ability to predict, with statistical limits, the behaviour of the process at any point within the design window. The independent variables (denoted by X1, X2…Xk) are assumed to be continuous and can be controlled with negligible error. The response is postulated to be a random variable. The response is postulated to be a random variable. For three independent variables X1, X2 and X3, the response Ra can be represented as a function of X1, X2 and X3 as follows [14]: |
 |
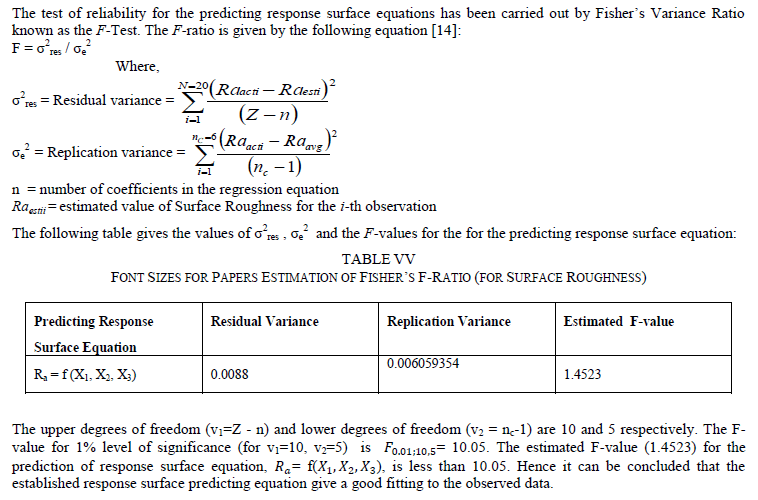
| E = a mathematical expectation The co-efficients of the fitted equations are obtained through the Response Surface Analysis in MINITAB Release 13.1 statistical software. The Second Order Response Surface Equation for Surface Roughness (Ra μm) is as follows: Ra = 0.51985 + 0.04932X1 + 0.02736X2 + 0.04925X3 + 0.01101X1X1 − 0.00490X2X2 − 0.00695X3X3 + 0.01040X1X2 + 0.02840X1X3 − 0.00055X2X3 |
 |
 |
 |
 |
V. CONCLUSION |
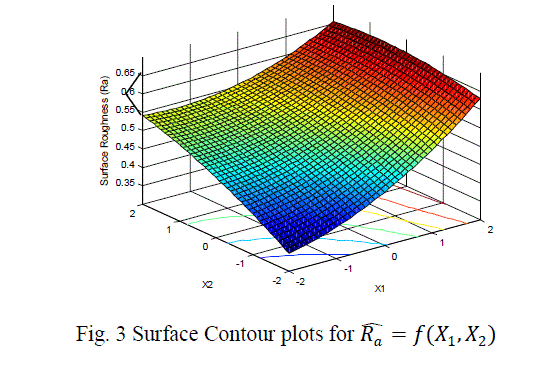
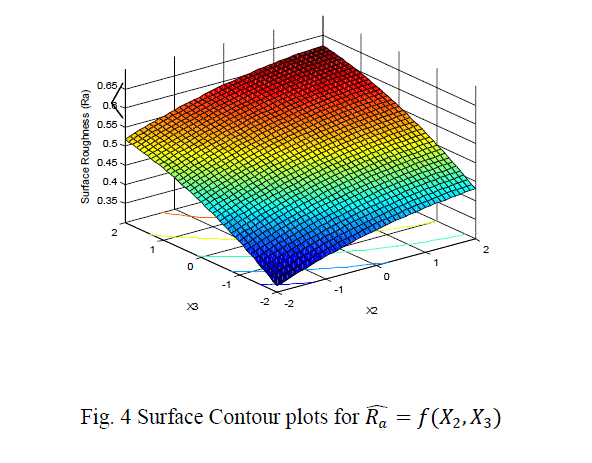
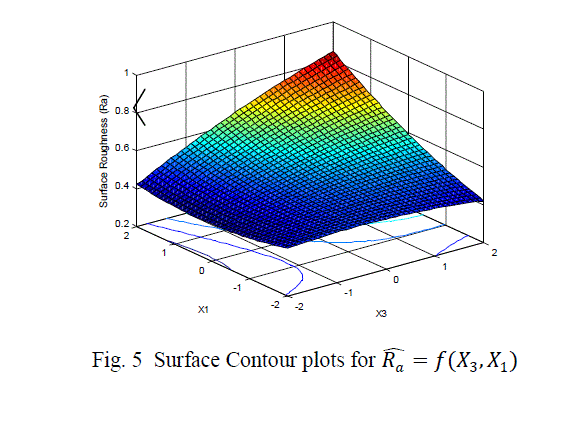
| The surface roughness is considered as the response in studentâÃâ¬ÃŸs test and it can be concluded that the Ni –ion source and Cu-ion source significantly influence the surface roughness at 10% level of significance. Also all the main effects (Ni-ion source, Cu-ion source, reducing ion source) and the interaction of Ni-ion and reducing agent, significantly influence the surface roughness at 20% level of significance. Fig 3-5 shows the surface plots and contour plots forïÿýïÿý a = f(X1, X2), ïÿýïÿý a = f(X2, X3), and ïÿýïÿý a = f(X1, X3). From fig 3 it can be observed that, keeping X3=0, for constant values of Copper source concentration (X2), the Surface Roughness of the samples increases with the increase in Nickel source concentration (X1).For constant values of X1, the Surface Roughness of the samples increases with the increase in copper concentration (X1) From fig 4 it can be observed that, keeping X1=0, for constant values of Copper source (X3), the Surface Roughness of the samples increases with the increase in copper concentration (X1) and then again decreases moderately. And for constant values of X2, the Surface Roughness increases upto a certain value of Copper source concentration (X2) and then again decreases moderately. From Fig 5 it can be observed that keeping X2 = 0, for constant values of reducing agent concentration (X3), the Surface Roughness decreases moderately and then again increases moderately upto a certain value of Nickel source concentration (X1). And for constant values of X1, the Surface Roughness increases moderately upto a certain value of reducing agent concentration (X3) and then again increases. |
ACKNOWLEDGMENT |
| The authors gratefully wish to express deep gratitude to Metrology lab, Jadavpur University, India, for providing facility to carry out the experiment. |
References |
|