ISSN ONLINE(2278-8875) PRINT (2320-3765)
ISSN ONLINE(2278-8875) PRINT (2320-3765)
| Adnan Shaout1, Raj Tonshal2 Department Electrical and Computer Engineering, The University of Michigan – Dearborn, United States |
| Related article at Pubmed, Scholar Google |
Visit for more related articles at International Journal of Advanced Research in Electrical, Electronics and Instrumentation Engineering
In developing an intelligent human machine interface (HMI) one of the critical components is knowing the state of the driver. Driving is a high cognitive activity and minimizing the distraction is critical. To address this, a Driver Activity Index (DAI) has been developed and presented in this paper to measure how busy the driver is. Two key driving parameters have been used to determine the driver activity index; Acceleration Pedal (ACC Pedal) and steering wheel angle measure. Fuzzy logic is used in modelling and predicting the DAI. Fuzzy logic modelling made computing the DAI in real time possible. Fuzzy logic also has simplified the computation of the DAI whose mathematical representation relating to the key vehicle driving parameters is complex to represent.
Keywords |
| Driver Activity Index, Vehicle HMI, CAN, IVI, Fuzzy Logic, Driver Cognitive Load, Acceleration Pedal, Steering wheel |
INTRODUCTION |
| Consumers have embraced both Digital electronic devices and In-Vehicle Infotainment (IVI) technologies. With almost all drivers having smartphones and with most of the new vehicles sold equipped with an IVI system, integrating the smartphone into the existing IVI would offer a great automotive driving experience. Even when digital consumer devices are integrating safely into the IVI, providing relevant and timely information to the driver is critical for the safe and rich driving experience. This requires the development of an intelligent human machine interface (HMI). Vehicle HMI poses unique challenges when compared to other appliances such as microwave ovens and dishwashers. Most home appliances are operated in static environment where the design guide lines for operating these appliances are not as stringent as vehicle HMI. Unlike fighter jet planes which are operated by highly skilled pilots, drivers tends to have large variation in the aspects of culture, gender, age and education background. One of the other important aspects is safety of the driver when operating a vehicle. In the last five years consumer embracing the smartphones and usage habits of theses devices poses challenge for safe driving. Another aspect is the multimodal HMI where information to the driver can be conveyed using audio visual and haptic. |
| Designing an intelligent HMI that is safe to operate while being aesthetically appealing is one of the primary goals for automotive original equipment manufacturers (OEM’s). Providing necessary information at the right time can reduce a great deal of driver distraction. In order to provide information to the driver knowing the state of the driver is important. The main objective of this project is to utilize the key orthogonal driving parameters acceleration pedal and steering wheel angle to determine the driver activity index. This Driver Activity Index can then be used as one of the key components in delivering the right kind of information at the right time to the driver. One of the examples could be to suppress the incoming call or message notification when the driver activity index is high. It’s worth noting that the Driver Activity Index can be utilized to decide on the visual content of the In-Vehicle-Infotainment (IVI) centre |
| There have number of studies to evaluate the driver work load; one such study is to evaluate Driver Activity Load Index based on subjective evaluation of the driver's mental workload [6]. Another study from Ford Motor [7] looks at evaluating the driver work load based on the statistical interpretation of vehicle sensor data. |
| This paper focuses on the development Driver activity Index using Fuzzy sets. Fuzzy logic is highly useful for controlling complex systems, where in the mathematic representation of a complex system is hard to realize and also the inputs to the system are less precise. Fuzzy logic is used quite extensively in automotive industry. In an automobile system there are number of complex control system problems. Even when some of these control problems can be mathematically represented, solving them on an inexpensive microcontroller when the inputs to the system are vague is not feasible. This is one of the main reasons for the wider adaption of Fuzzy logic to solve control system problems in the automotive industry. |
| With the advent of Internet Of Things (IOT) [4] and modern automobiles integrating with the smart devices distracted driving has become one of the major issues for the automotive industry. |
| The paper is organized into the following sections; section 2 presents the driver data collection system; section 3 presents the development of the driver activity index using fuzzy modelling; section 3 presents the verification of the fuzzy model; section 4 presents future work; in section 5 fuzzy vs non-fuzzy method will be presented and finally in section 6 we conclude. |
THE DRIVER DATA COLLECTION SYSTEM |
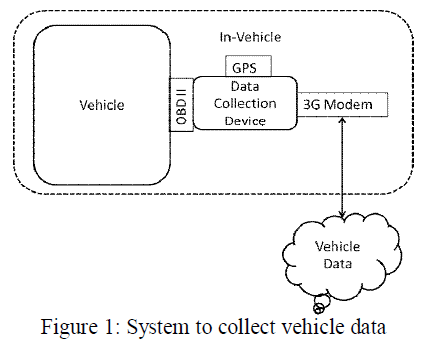
| In developing the fuzzy model understanding the inputs is a key step and it helps in the fuzzification of the inputs. An On-Board Diagnostics (OBD) II [3] embedded system is used to collect key input parameters in the real driving conditions. Along with the hardware cloud storage is used to store the vehicle data for later analysis. The device is connected to the OBD II port of the vehicle and the device has an embedded modem attached to it. An external GPS is connected to the device to geocode the vehicle data collected with latitude and longitude [5]. The block diagram of the system used to collect the driver data is shown in figure 1. |
 |
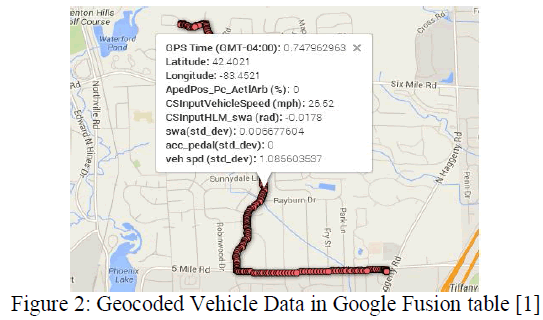
| The data is collected every second and the format of the data collected in the cloud is comma separated values (CSV) of acceleration pedal position (%), vehicle speed (mph), steering wheel angle (radians) and GPS co-ordinates (latitude and longitude). Figure 2 shows the geocoded vehicle data in Google Fusion table [1] at an instant time where the data is collected in CSV format. |
 |
| Figures 3, 4 and 5 shows the variation of vehicle speed, acceleration pedal position and steering wheel angle, respectively. The raw data values shown in the figures from the vehicle could be used as the inputs to the driver activity index system. The inputs, ACC pedal, steering wheel angle and vehicle speeds are crisp inputs, would have to be fuzzified assuming that each input would be allocated some linguistic vales such as low, medium and high. |
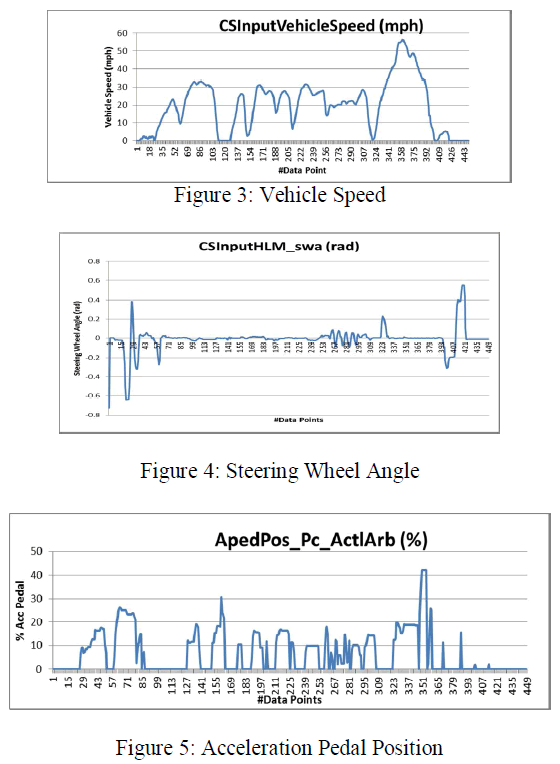 |
| The current vehicle CAN bus samples data at the rate of 1Hz. The input data from the CAN bus will be utilized for ACC Pedal and steering wheel angle. The fuzzy system will use the data raw and will not be statistically processed as this might add more computations. |
DEVELOPMENT OF DRIVER ACTIVITY INDEX USING FUZZY MODEL |
| Currently in the automobile industry there are no systems that have the capability of detect the Driver Activity Index. One can think of having sensors like biometric and camera to detect the activity of the driver, but wide spread integration of these sensors into to the automobile system is about 5 to 10 years away. Hence in this paper we are proposing the development of Driver Activity Index based on the current sensor data that’s already available on the vehicle’s CAN bus. |
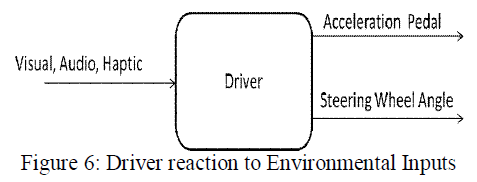
| Active driving process involves driver reacting to the visual, auditory and haptic inputs from the environment. In case of vehicle equipped with automatic transmission, driver reacts to the external inputs using the human machine interfaces that have been provided to them in the vehicle. |
| And also there are voluntary activity related to the use of human machine interface to enable or disable infotainment and driver assist features. For this paper, driver voluntary activity related to the use of IVI is not taken into consideration while calculating the DIA. The block diagram shown in figure 6 illustrates the driver reaction to environmental inputs, visual/audio or haptic with modification to acceleration pedal, steering wheel angle and brake pedal. |
 |
| In the current new Fuzzy model only ACC pedal and steering wheel angle are considered as fuzzy inputs and the brake pedal data will be considered as a crisp input since it is available as only an on and off vehicle CAN message. |
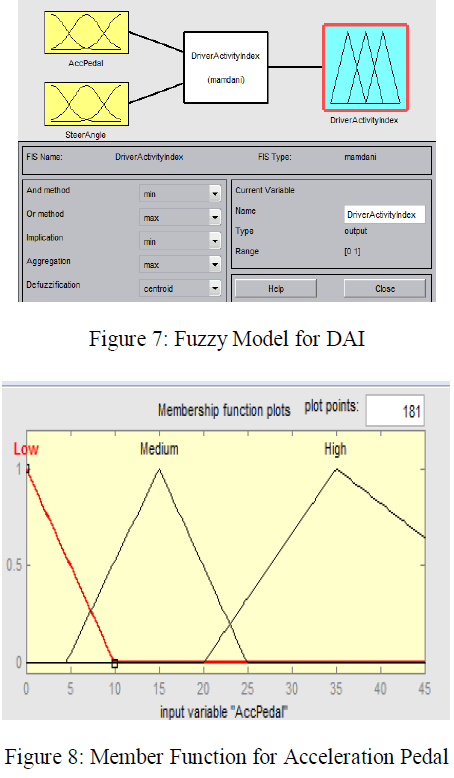
| In developing the Fuzzy model for Driver Activity Index, Matlab Fuzzy tool box [2] is utilized. Figure 7 shows the Fuzzy model for the DAI. The model has two inputs, ACC pedal and steering wheel angle, and one output, Driver Activity Index. |
 |
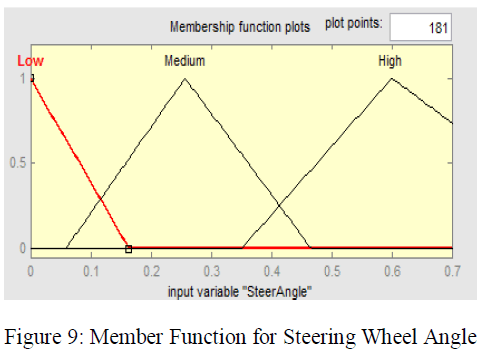 |
| The linguistic values (input membership functions) are shown in Figures 8 and 9 for acceleration pedal and steering wheel angle respectively. The universe of discourse for the ACC pedal and steering wheel angle is chosen based on the expert knowledge of the real vehicle data collected. |
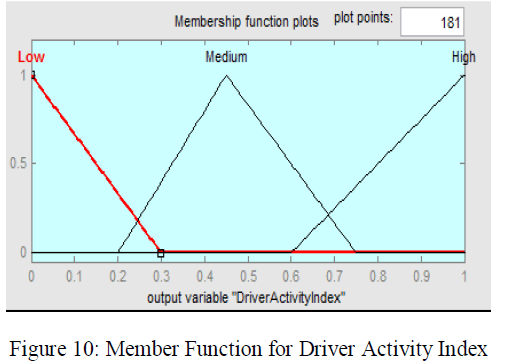 |
| Figure 10 shows the linguistic values (the membership functions) for the fuzzy output variable Driver Activity Index (DAI), which is the only output for the Fuzzy model. “min-max” is used for the implication and aggregation. Centroid method is used for the defuzzification. Nine rules were used for the Fuzzy model. |
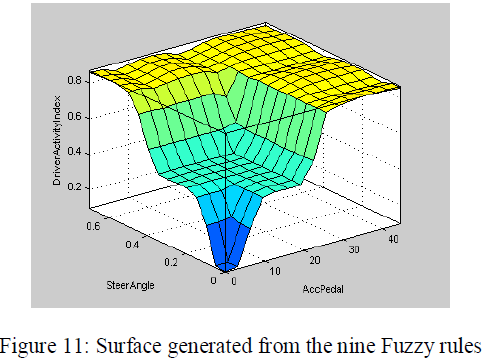 |
| Figure 11 shows the surface that was generated from the nine fuzzy rules. The rule base has nine rules because each fuzzy input variable has three linguistic values. Rules are formatted as follows: “If ACCPedal (low, medium, or high) is and SteeringAngle is (low, medium, or high) then DriverActivityIndex is (low, medium, or high) “. |
| It’s worth noting that, only two inputs are considered for modelling. Since the steering wheel angle ranges from positive and negative values to consider for clockwise and anticlockwise rotation and an absolute value of the steering wheel angle is taken into account for negative values in rotation. This implies that the model will not be able to differentiate between left and right turns. |
VERIFICATION OF THE FUZZY MODEL |
| The Fuzzy model developed was verified with the vehicle CAN data. The acceleration pedal and steering wheel angle data were collected at 1 Hz, since sampling at higher frequency does not add more information. The sample Matlab functions for generating the output DAI is described in figure 12. Vehicle CAN data is just converted to engineering data, for ACC pedal its “%” of the pedal depression and for the steering wheel angle it’s in absolute radians as we don’t want to treat left and right turning angles differently. Any further mapping or transformation of data adds computation, hence only the raw vehicle CAN data is used as an input to the Fuzzy Model. |
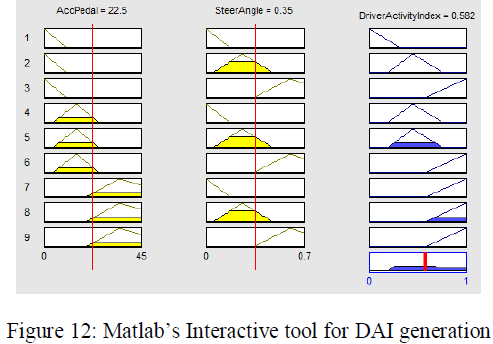 |
| The Matlab code for reading the DAI fuzzy model, reading the CSV data of the ACC pedal and steering wheel angle and evaluating the DAI is as follows: |
| // Read the Driver Activity Index Fuzzy Model |
| fis = readfis('DrivityActivityIndex.fis'); |
| // Read the CSV data of ACC Pedal and Steering Wheel Angle |
| M = csvread('data_for_simulink.csv') |
| // Evaluate the Driver activity index using the matrix M |
| out =evalfis(M,fis) |
| Figure 13 shows a sample result for DAI. |
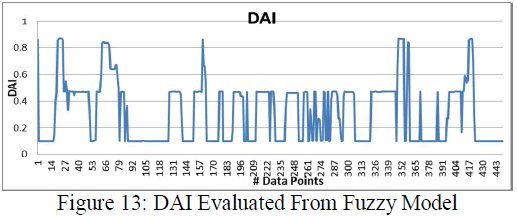 |
| It’s worth noting from figure 13 that the peaks for high work load appears when there is high values for ACC pedal and steering wheel angle. The result does correlate very well with the “expert knowledge”, when the driver is stepping on the ACC pedal or when driver is taking a turn the driver activity Index (DAI) is high. |
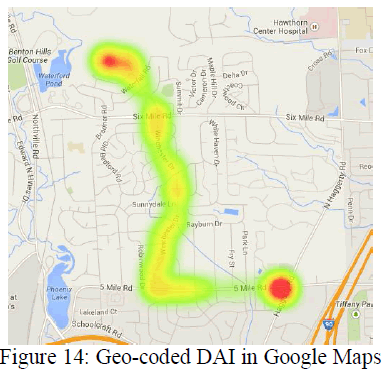 |
| The heat map of the DAI is shown in figure 14 using the Google Maps as the vehicle is driven from one location to another. It’s also worth noting the higher values for DAI as the vehicle is starting and stopping. And also the DAI is higher around the turns. |
FUTURE WORK |
| The developed Fuzzy model will need to be integrated into an embedded system to alert the driver when the driver activity index is high in real time. The embedded system will be the same system that’s currently being used to collect the vehicle data. It’s worth noting that the new feature does not need any new sensors to be added to the existing system. |
| DAI calculation can further be enhanced by taking into consideration driver activity related to the infotainment and driver assist features. Current the model does not take data related to the infotainment activity since not all data related to IVI is available on the vehicle CAN bus. Other inputs can also be added which are context and location aware environmental data such as traffic condition, road condition and weather condition. |
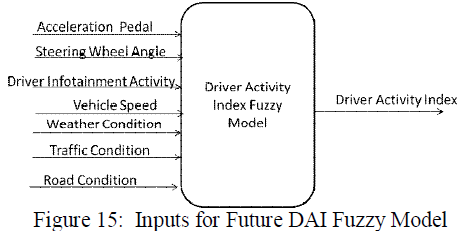 |
| Figure 15 represents the inputs that can be considered into calculating the driver activity index. To reduce the number of inputs one can think of using stage-wise fuzzification [8]. The inputs weather condition, road condition and traffic conditions can be further combined to produce a single input; “Environmental State” input. Utilizing this method makes the system modular. To that end, the “cloud” computing resource could also be utilized for producing the “Environmental State” output as cloud can aggregate weather, traffic and road conditions data as they are available through other external web sources. |
FUZZY VS NON-FUZZY METHOD |
| The nature of inputs that we are utilizing to calculate the driver activity index tends to be not crisp. Hence the problem of calculating the driver activity index is really a classical fuzzy problem. And also as shown in Figures 15, as the number of inputs that can be considered to calculate the driver activity index increases, the mathematical representation relating the driver activity index to the inputs becomes complex. Mathematically calculating the driver activity index in real time is big challenge. Another advantage of Fuzzy is the ability to compute Driver activity index on smaller and cheaper microprocessor which is an important consideration for Automotive OEM’s. |
CONCLUSION |
| In this paper a Driver Activity Index is calculated using fuzzy model. The calculated Driver Activity Index can be used for developing an intelligent In-Vehicle-Infotainment (IVI) system. The DAI is calculated using the existing vehicle data without requiring any new sensors. The developed fuzzy model is validated against the real vehicle data. The results have shown that fuzzy model is very effective. |
References |
|