ISSN ONLINE(2320-9801) PRINT (2320-9798)
ISSN ONLINE(2320-9801) PRINT (2320-9798)
| Prof. Shanthi Mahesh1, Dr. Neha Mangla2, Pooja V3, Suhas A Bhyratae4 Department of ISE, Atria Institute of Technology, Bengaluru, Karnataka, India |
| Related article at Pubmed, Scholar Google |
Visit for more related articles at International Journal of Innovative Research in Computer and Communication Engineering
Gene regulation refers to a number of sequential processes, the most well-known and understood being translation and transcription, which control the level of a gene’s expression and ultimately result with specific quantity of a target protein. Reconstruction of gene regulatory networks is a process of analyzing the steps involved in gene regulation using computational techniques. In this paper, cancer-specific gene regulatory network has been reconstructed using information theoretic approach-Mutual Information. The microarray database used contains 12 Gene samples each of breast cancer and prostate cancer having both normal and tumor cell information. This data has been preprocessed, normalized and filtered using the t-test; the MI value is applied on the filtered genes to determine the Gene-Gene Interaction. Based on the interactions obtained, 10 different networks have been constructed and the statistical analysis has been performed on that network. Finally, validation of the inferred results has been done with available biological databases and literature.
KEYWORDS |
| gene regulatory network, microarray, reactive stroma of breast and prostate cancer, mutual information |
I. INTRODUCTION |
| Malignant cancer is one of the most widespread diseases in today’s world that affects the mortality rate of human beings. The cancerous cells divide and grow in an uncontrollable manner forming tumors and infest the nearby part of body. Various significant genes are responsible for the genesis of different tumors. Radiotherapy, chemotherapy and surgery are the possible ways of treating cancer. Therefore, identification of genes that lead to cancer can typically solve the uncontrollable growth of cancer at an early stage. |
| Reconstruction of g e n e r e g u l a t or y n etwor ks (GRNs) explicitly represents the causality of developmental or regulatory process. It has become a challenging computational problem for understanding the complex regulatory mechanisms in cellular systems. An important problem in molecular biology is to identify and understand the gene regulatory networks (GRNs). Microarray technologies have produced tremendous amounts of gene expression data, which provide opportunity for understanding the underlying regulatory mechanism. |
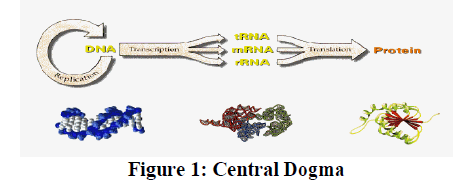
| Recently, information theoretic approaches are increasingly being used for reconstructing GRNs. Several mutual information based methods have been successfully applied to infer GRNs and minet. In general, these approaches start by computing the pair-wise MIs between all possible pairs of genes, resulting in an MI matrix. The MI matrix is then manipulated to identify the regulatory relationships. MI provides a natural generalization of the correlation since it measures non-linear dependency and therefore attracts much attention. Another advantage of these methods is their ability to deal with thousands of variables (genes) in the presence of a limited number of samples. With these advantages, MI-based methods only work when investigating pair-wise regulations in a GRN. The inference of gene networks from high-throughput data is a very complex and vastly expanding; triggered by the invention of measurement technologies. In order to provide a systematic discussion of the underlying principles we limit this review to observational steady-state gene expression data and consider correlation-and mutual informationbased inference methods. These methods are representative of linear and non-linear methods. Principally, there are three fundamental levels of a molecular system as given by the central dogma of molecular biology (Crick, 1970), namely, the DNA, mRNA and the protein level. Figure 1 shows the overview of Central Dogma. The central dogma of molecular biology describes the two-step process, transcription and translation by which the information in genes flows into proteins: |
| DNA->RNA->Protein |
 |
| In this work, we propose a relevance network model for gene regulatory network inference which employs mutual information to determine the interactions between genes. For this purpose, we propose a mutual information estimator based on adaptive partitioning which allows us to condition on both discrete and continuous random variables. We provide experimental results that demonstrate that the proposed regulatory network inference algorithm finds the high degree genes and predicts the gene responsible for both breast cancer and prostate cancer. The results are validated using biological database. |
II. LITERATURE SURVEY |
| The reconstruction or ‘reverse engineering’ of GRNs, which aims to find the underlying network of gene–gene interactions from the measurement of gene expression is considered one of most important goals in systems biology [2,3]. For this, the Dialogue for Reverse Engineering Assessments and Methods (DREAM) program was established to encourage researchers to develop new efficient computation methods to infer robust GRNs [4]. A variety of approaches have been proposed to infer GRNs from gene expression data [5,7], such as discrete models of Boolean networks and Bayesian networks[8], differential equations [9-12], regression method[13,14] and linear programming [15]. Although many popular network inference algorithms have been investigated [16, 5], there are still a large space for current models to be improved [20]. Recently, information-theoretic approaches are increasingly being used for reconstructing GRNs. Several mutual information (MI)- based methods have been successfully applied to infer GRNs, such as ARACNE, CLR [23] and minet [21]. In general, these approaches start by computing the pair-wise MIs between all possible pairs of genes, resulting in an MI matrix. The MI matrix is then manipulated to identify the regulatory relationships. MI provides a natural generalization of the correlation since it measures non-linear dependency (which is common in biology) and therefore attracts much attention. Another advantage of these methods is their ability to deal with thousands of variables (genes) in the presence of a limited number of samples. Despite these advantages, MI- based methods only work when investigating pair-wise regulations in a GRN. |
III. ABBREVIATIONS |
| DNA: Deoxyribo nucleic acid RNA: Ribonucleic acid NCBI: National center for Biotechnology Information GEO: Gene expression omnibus TMI: Threshold Mutual Information Microarray: Collection of microscopic DNA spots attached to solid surface. MI: Mutual Information. GRN: Gene Regulatory Network. |
IV. DATASET DESCRIPTION |
| Evaluation of t h e performance of our approach is experimentally tested on the Reactive stroma of breast and prostate cancer dataset. The full data set can be downloaded from the Gene Expression Omnibus website: http://www.ncbi.nlm.nih.gov/geo/GSE26910. The dataset has information on 54675 genes under 24 different experimental conditions. |
V. METHODOLOGY |
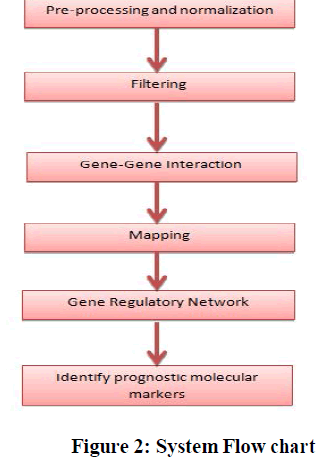
| The algorithm presented in this approach is shown in Figure 2. |
 |
| A. Preprocessing and Normalization |
| The dataset is quite large with 54675 genes and a lot of information corresponds to genes that do not show any interesting changes during the experiment. During the pre- processing, genes that do not show any changes during the experiment are removed which reduces the size of the dataset. If we look through the gene list, we have several spots marked as ‘EMPTY’. These are empty spots on the array and these spots can be noise. The function isnan() is used to identify the genes with missing data and indexing commands are used to remove the genes with missing data. |
| B. Filtering |
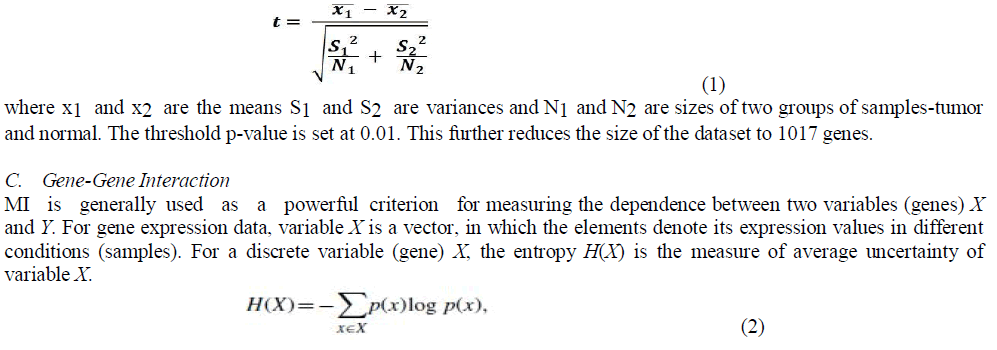
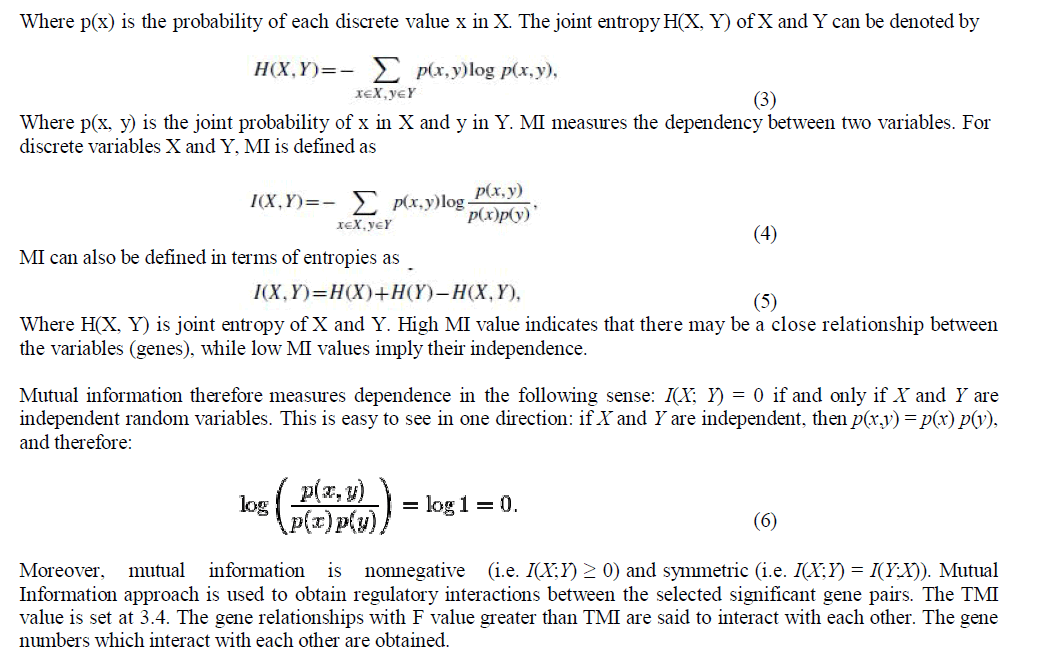
| T-test is applied between the normal and tumor cell data to obtain the most significant genes. The t-test for unpaired data and both for equal and unequal variance can be computed as |
 |
 |
| D. Mapping |
| The gene interaction matrix obtained in the previous step is mapped onto the gene names. |
| E. Gene Regulatory Network |
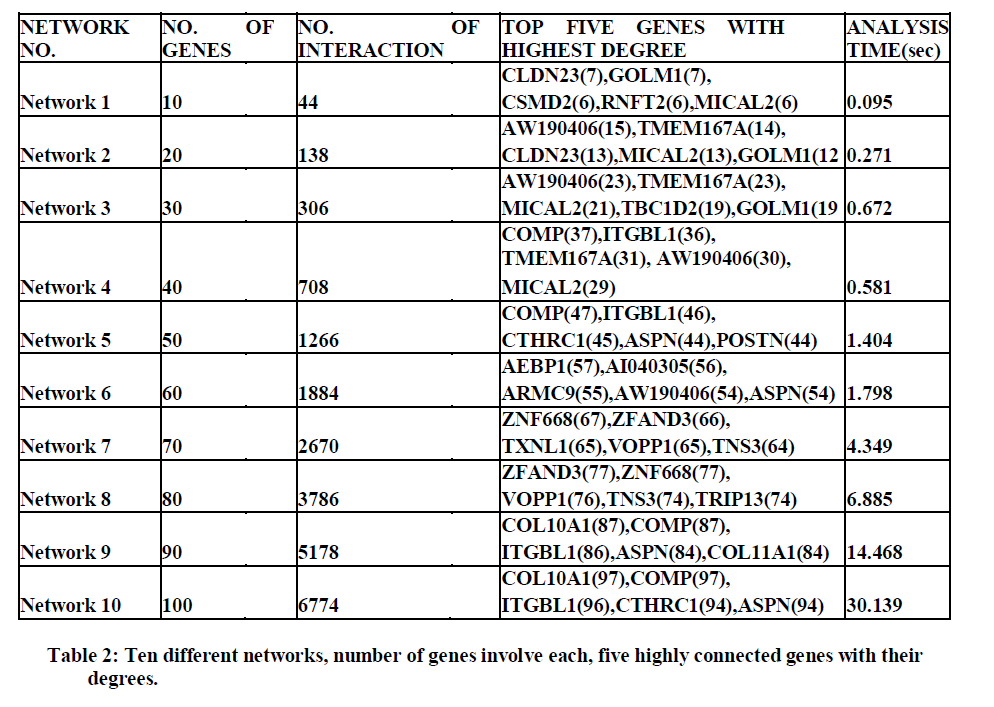
| The result of gene-gene interaction matrix is imported into the network visualization and analysis tool, Cytoscape. Cytoscape is more powerful when used in conjunction with large databases of protein-protein, protein-DNA and genetic interactions that are increasingly available for humans and model organisms. It allows the visual integration of the network with expression profiles, phenotypes and other molecular state information and links the network to databases of functional annotations. The interacting genes are selected to obtain networks of interacting genes. This helps us in easily identifying the genes with highest degree. Such genes, called as highly connected genes, are said to have a higher impact in causing cancer. |
| F. Identify prognostic molecular markers |
| The highly connected genes are used in the identification of the prognostic molecular markers. This analysis is done using. This analysis is done using G2SBC (Genes-to-Systems Breast Cancer Database) .The G2SBC is a bioinformatics resource that collects and integrates data about genes. From this analysis it is found that the genes GOLM1, CSMD2, MICAL2, TMEM167A, TBC1D2, POSTN, AEBP1, ZNF668, ZFAND3, TXNL1, VOPP1, TRIP13 are common for causing both breast and prostate cancer [22]. |
VI. EXPERIMENTS AND RESULTS |
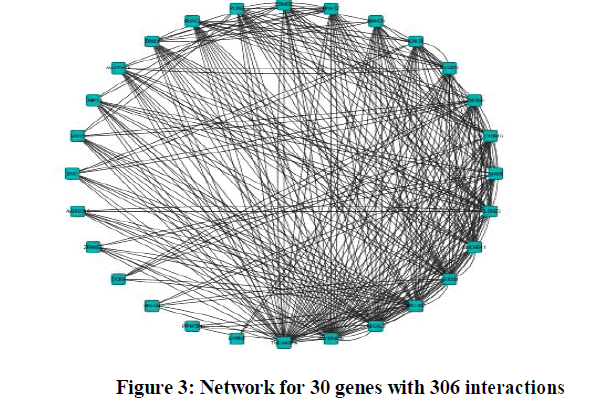
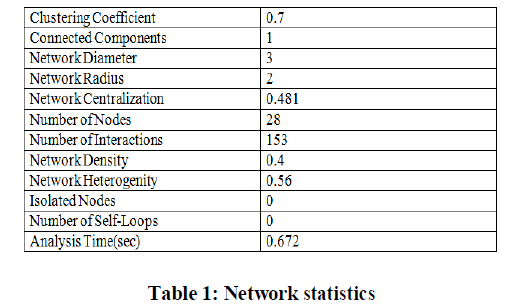
| Experiments were conducted on the reactive stroma of breast and prostate cancer with 54675 genes under 24 different experimental conditions. Regulatory network for 30 genes with 306 interactions is shown in the Figure 3. Statistical analysis of GRN for 30 genes is shown in table 1. |
 |
 |
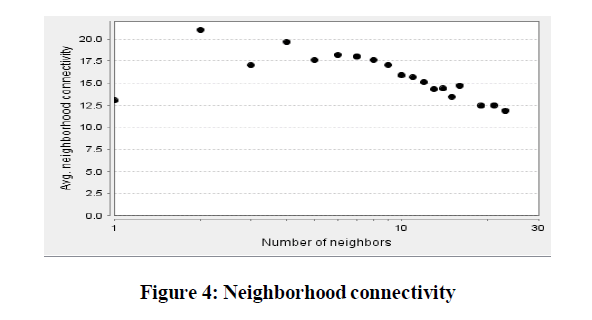
| 1. Neighborhood Connectivity: The connectivity of a node is the number of its neighbors. The neighborhood connectivity of a node n is defined as the average connectivity of all neighbors of n, Figure 4. The neighborhood connectivity distribution gives the average of the neighborhood connectivity of all nodes n with k neighbors for k = 0,1,…. |
 |
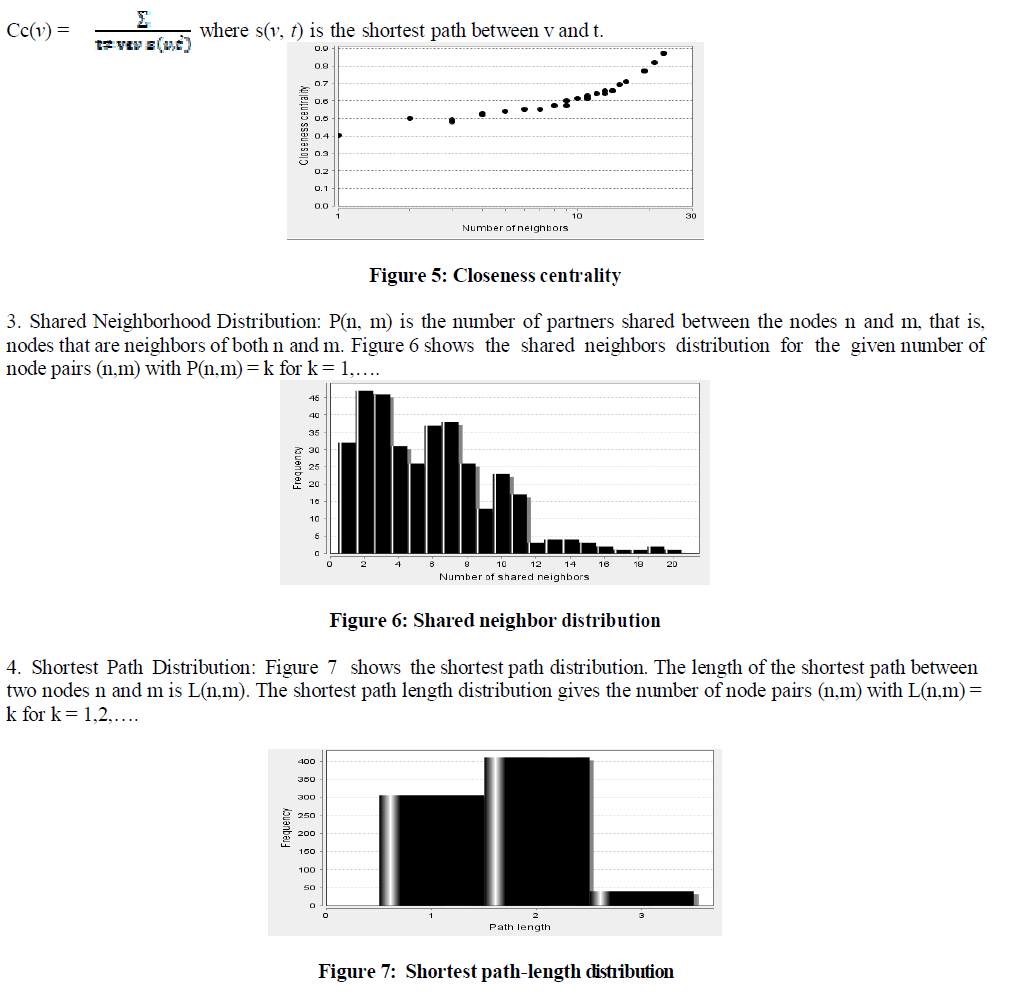
| 2. Closeness centrality: It is the degree to which this node is close to all nodes. Figure 5, shows the closeness centrality plotted against number of neighbors. It is calculated ba s ed on sh or t e s t pa th s, i t i s g i ve n b y, |
 |
VII. CONCLUSION |
| In this work, a novel approach comprising the features viz, filtering function, mutual information and gene-gene interaction function have been used on the cancer data to compute regulatory relationship between gene pairs and statistical analysis of reconstructed network. The microarray data considered here consists of 54675 genes having 12 sets each of breast and prostate cancer data and 12 each of normal cell data. Our study yields 6 major outcomes; first we identify differentially expressed genes in dataset, second, the interactions between differentially expressed gene have been identified; third, genes regulating most of the other genes were identified; fourth, provides the statistical analysis of reconstructed network revealed a large number of interactions in the used data; fifth, provides the highly connected gene for 10 different network and sixth, helps to identify the prognostic molecular markers in the reactive stroma of breast and prostate cancer using G2SBC. From this analysis it is found that the genes GOLM1, CSMD2, MICAL2, TMEM167A, TBC1D2, POSTN, AEBP1, ZNF668, ZFAND3, TXNL1, VOPP1, TRIP13 are common for causing both breast and prostate cancer. The result provides an excelled understanding of the interaction mechanism of the breast and prostate cancer data and provides new insight into the biomedical world. |
 |
References |
|