ISSN ONLINE(2278-8875) PRINT (2320-3765)
ISSN ONLINE(2278-8875) PRINT (2320-3765)
Mohit Kumar1, Ram Avtar Jaswal2
|
| Related article at Pubmed, Scholar Google |
Visit for more related articles at International Journal of Advanced Research in Electrical, Electronics and Instrumentation Engineering
In this paper, the reliability of 66kv/400v substation has been analysed. When more complexities increase in the system, the reliability evaluation becomes more difficult. Thus, the derivation of symbolic reliability expression is simplified. The general system for compact form is very helpful. Boolean function technique simplifies the complexity of any system. By Boolean function technique, a mathematical model for measuring reliability has been developed. In the terms of reliability for substation, the failure rate and mean time to failure are to be calculated.
Keywords |
| Boolean Function Technique, Reliability, Failure Rate, M.T.T.F |
INTRODUCTION |
| Reliability of a unit (or product) is the probability that the unit performs its intended function adequately for a given period of time under the given stated operating conditions or environment. Reliability definition stresses four element: probability, intended function, time and operating conditions [1]. Gupta P.P, Agarwal S.C have considered a Boolean Algebra Method for Reliability calculations and again Gupta P.P Kumar Arvind, Reliability and M.T.T.F Analysis of Power Plant. Sharma, Deepankar Sharma, Neelam, Evaluation of some Reliability Parameters for Tele-communication system by Boolean Function Technique [2][3][4][5]. [6][7][8][9] The reliability of several electronic equipments by using various techniques has been calculated, but the method adopted by them lead to cumbersome and tedious calculation. Keeping this fact in view, for the evaluation of various factors of reliability of 66kv/400v substation., the authors have applied Boolean function technique. |
| The block diagram of 66kv/400v substation is shown in figure 1. Two 66kv incoming lines are connected to bus bars. Such an arrangement having two incoming lines is called double circuit. Any one of line can be utilised at one time or both can also be utilised. In 66kv substation in this arrangement by which 66kv double circuit supply is going out. To step down it to 11kv, there are two step down transformers unit connected in parallel. That means if one is under repair or faulty, other can work, not whole system shuts down. It is further connected with gang operating switch with current transformer and then to step down transformer to 400v [10]. |
 |
RELIABILITY BY BOOLEAN FUNCTION TECHNIQUE |
| The reliability of substation is determined, mathematical model has been developed shown in figure2. The following assumptions are to be made for applying Boolean function technique: |
| 1. First of all ,ensure that all the equipments are good and operable. |
| 2. The state of all components of the system is statistically independent. |
| 3. The state of each component and as whole system either operable, workable, good or fail. |
| 4. There is no repair facility. |
| 5. Supply between any two components of the system is hundred percent reliable and perfect ok . |
| 6. The failure times of all components are arbitrary. |
| 7. In advance, the reliability of each component shold be known . |
 |
| Notations |
| X1, X2 = State of both transmission lines |
| X3 = State of Bus Coupler |
| X4, X5 = State of both buses |
| X6, X7 = State of 11kv step down transformers |
| X8 = State of G.O. Switch |
| X9 = State of oil circuit breaker |
| X10 = State of current transformer |
| X11 = State of 400v step down transformer |
| Xi(i = 1,2,…11) = 1 in good state and 0 in bad state |
| XiâÃâ¬ÃŸ = negation of Xi |
| ^ = Conjunction |
| ̢̢̉̉̉̉= Logical Matrix |
| Ri = Reliability of ith part of the system |
| Qi =1-Ri |
| Rs = Reliability of Whole System |
| RSW(t)/RSE(t) = Reliability of the system as a whole when failures follow Weibull /Exponential time distribution. |
FORMULATION OF MATHEMATICAL MODEL |
| The successful operation of the system in terms of logical matrix is expressed as: |
| F(X1 X2 --------------------------------------------------- X11) = |
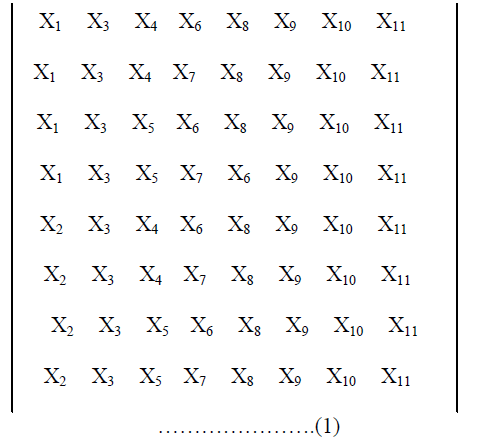 |
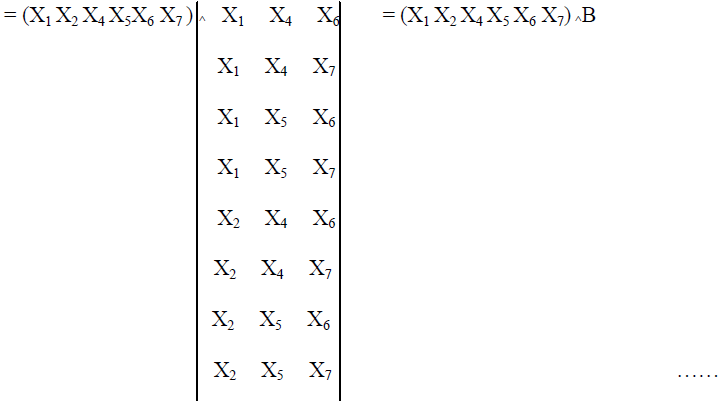 |
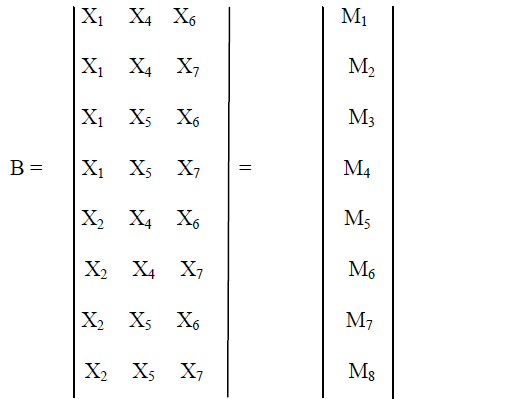 |
| By Orthogonalisation algorithm, above equation can be written as |
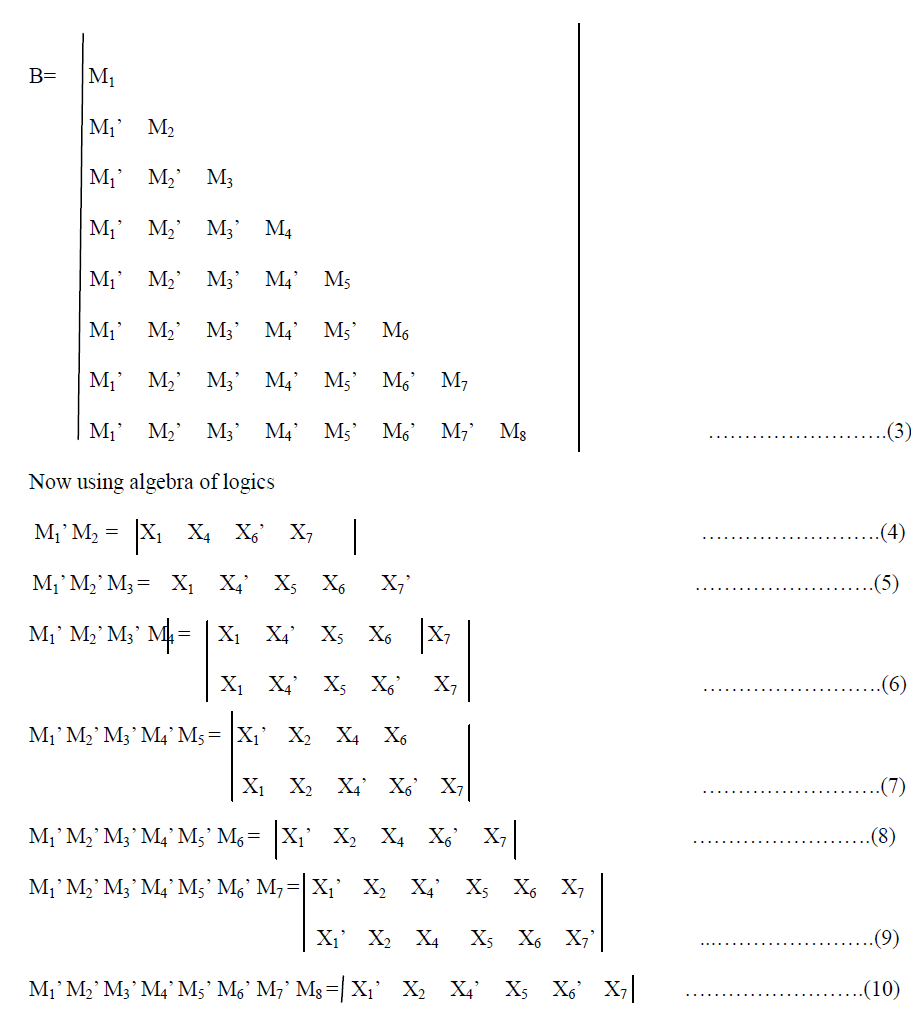 |
| By using equation 3-10 |
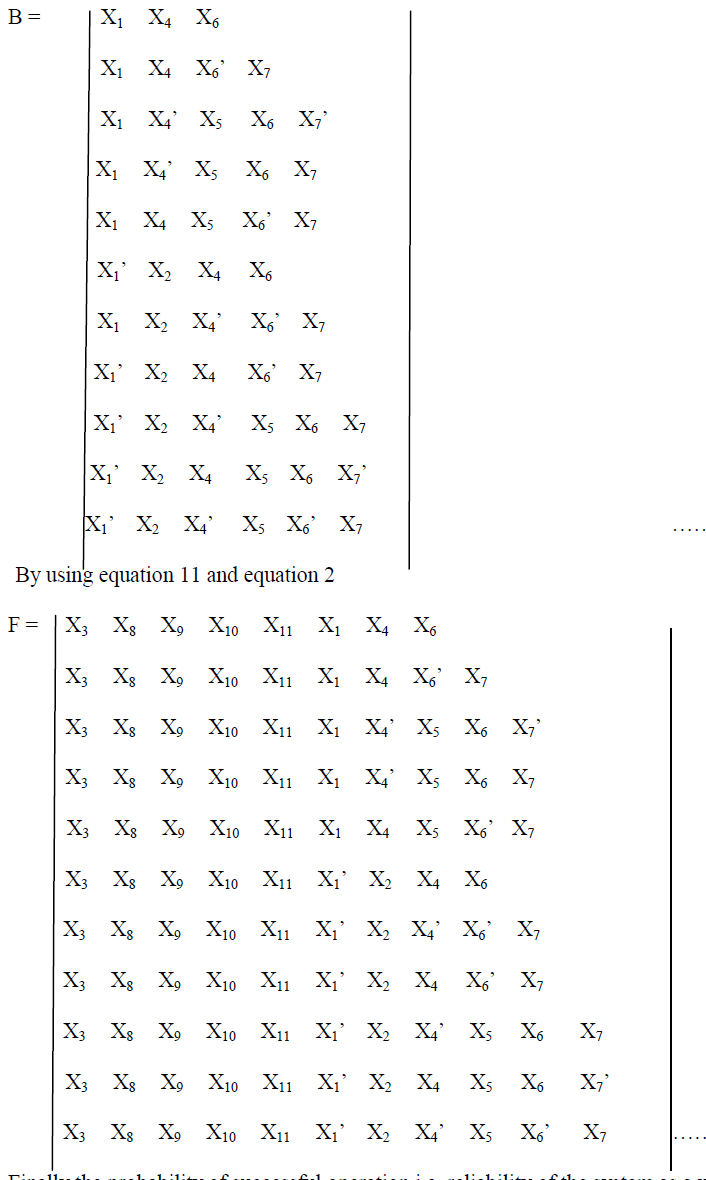 |
| Finally the probability of successful operation i.e. reliability of the system as a whole is given by |
| RS = R3 R8 R9 R10 R11 [R1 R4 R6 + R1 R4 (1-R6) R7 + R1 (1-R4)R5 R6 (1-R7) + R1 ( 1-R4) R5 R6 R7 + |
| R1 R4 R5 (1- R6) R7 + (1-R1) R2 R4 R6 + (1-R1) R2 (1-R4) (1-R6) R7 + (1-R1) R2 R4 (1-R6) R7 + |
| (1-R1) R2 (1-R4) R5 R6 R7 + (1-R1) R2 R4 R5 R6 (1-R7) + (1-R1) R2 (1-R4) R5 (1-R6) R7] |
A. Some Particular Cases |
Case1: When all failures follow Weibull’s Criteria |
| Let λi will be the failure rate of components corresponding to system state Xi and it follows weibull time distribution. Then reliability function of considered system at time„tâÃâ¬ÃŸ is given as: |
 |
| When λ1 = λ2 = -------------- λ11 = λ then from above equation |
Case –II: When all failures follow Exponential time distribution |
| Exponential distribution is a particular case of weibull distribution for . Hence the reliability of a whole system at an instant„tâÃâ¬ÃŸ is given by |
 |
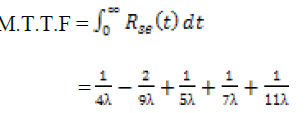
| and the expression for M.T.T.F in this case is |
 |
NUMERICAL COMPUTATIONS |
| For a numerical computation, let us consider the values |
| i. Setting λi(i = 1,2,3….11) = 0.001 and in equation 15 |
| ii. Setting λi(i = 1,2,3….11) = 0.001 in equation 16 |
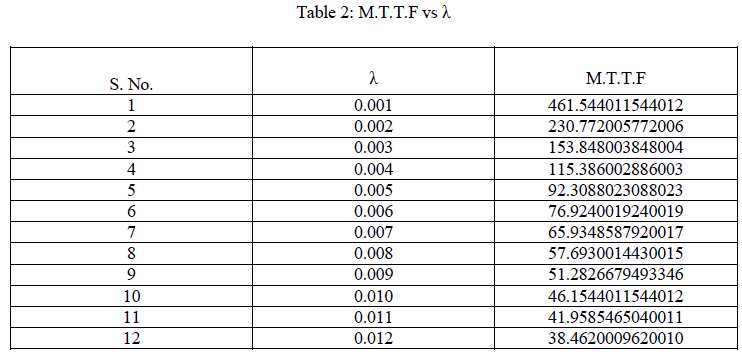
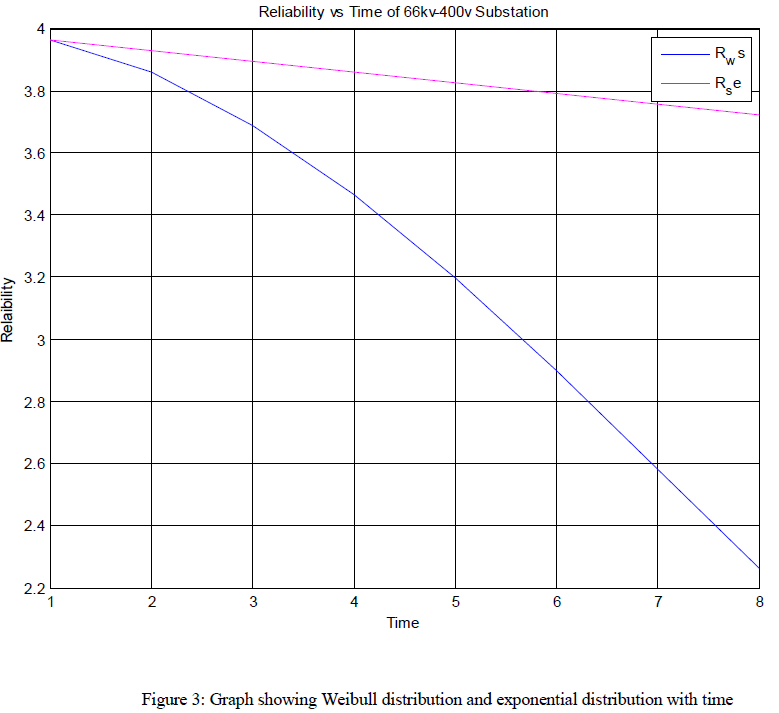
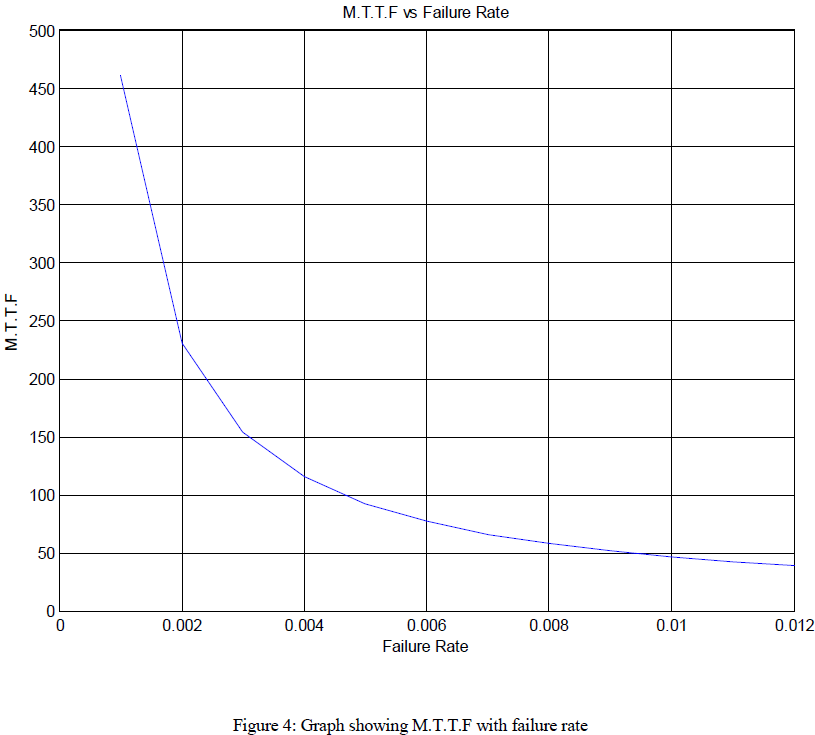
| iii. Setting λi(i = 1,2,3….11) = 0.001…….0.012 in equation 17 table 1 and table 2 has been computed and corresponding graphs are shown in figure 3 and 4 respectively. |
 |
 |
 |
 |
CONCLUSION |
| In this paper, we considered 66kv/400v substation for analysis of various reliability parameters by employing the Boolean function technique & algebra of logics. Table 1 computes the reliability of the system with respect to time when failures rates follow exponential and Weibull time distributions. An inspection of graph “Reliability Vs Time” (fig3) reveals that the reliability of the complex system decreases approximately at a uniformly rate in case of exponential time distribution, but decreases very rapidly when failure rates follow Weibull distributions. Table 2 and graph “MTTF V/S Failure Rate (fig-4) yields that MTTF of the system decreases catastrophically in the beginning but later it decreases approximately at a uniform rate. |
References |
|