ISSN ONLINE(2278-8875) PRINT (2320-3765)
ISSN ONLINE(2278-8875) PRINT (2320-3765)
Prof. N.M Karajanagi1, Priya Karhade2, Sonal Vaidya3, Lakhan Bajaj4, Akshay Hagawane5
|
| Related article at Pubmed, Scholar Google |
Visit for more related articles at International Journal of Advanced Research in Electrical, Electronics and Instrumentation Engineering
GMRT (Giant Meter wave Radio Telescope) is the world largest telescope operating at meter wavelength, it is located in Khodad, Dist: Pune (India). It consists of 30 antennas placed in ‘Y’ shape within the radius of 25 kms. To keep the system healthy and to check up the power stability RF power monitoring is necessary. From 30 antennas, 60 monitoring channels i.e. left hand circular polarized and right hand circular polarized signals from each antenna are fetched. Through RF switch one signal is selected from 60 signals thus single signal is monitored at a time. For monitoring and controlling signals National Instrument’s LabVIEW software is used. LabVIEW is a graphical programming software tool which is used for controlling Spectrum Analyzer. Signal’s power and respective time is stored in text format for further analysis. Online monitoring of signals is also possible from any location so that anyone can access that information. The acquired information is useful for Astronomical research.
Keywords |
| Radio Frequency, LabVIEW, RF switch, Labjack card, Java. |
INTRODUCTION |
| Radio waves are generally utilized by antennas of appropriate size (according to the principle of resonance), with wavelengths ranging from hundreds of meters to about one millimeter. They are used for transmission of data, via modulation. Television, mobile phones, wireless networking, and amateur radio all use radio waves. The use of the radio spectrum is regulated by Government Authorities through frequency allocation. Radio frequency (RF) is a rate of oscillation in the range of around 3 kHz to 300 GHz. |
| As the GMRT consists of 30 antennas, 14 antennas are distributed in 1 square kilometer area and remaining 16 antennas are arranged in ‘Y’ shape in radius of 25 kms. These antennas receive RF spectrum in wide range and cover around 45% of universe. These antennas receive signal in two linear polarization which are then combined together to form circular polarization. In earlier system observation was done in 5 bands and they were converted to IF signals of 32 MHz bandwidth. With Up gradation in GMRT system we are having seamless coverage from 50 MHz to 1600 MHz, now this RF signals are brought directly to Central Electronic Building(CEB) via optical fiber cable without any IF conversion(intermediate frequency). The system works on narrow band situated at different frequencies with advancement in technology which enables to process 400MHz bandwidth at a time. |
| PC based data acquisition DAQ) systems in measurement and analysis is gaining importance in industry and research organizations as this can be used for teaching, research and product development due to its flexibility of using virtual instrumentation technologies. Laboratory Virtual Instrumentation Engineering Workbench (LabVIEW) is a graphical programming environment based on the concept of data flow programming. This programming paradigm has been widely used for data acquisition and instrument control. There are three important components involved in test and measurement applications, namely data acquisition, data analysis and data visualization. |
RELATED WORK |
| The Giant Metre-wave Radio Telescope (GMRT) is a recent world class instrument for studying astrophysical phenomena at low radio frequencies (40 to 1450 MHz). GMRT has been designed and built in India by NCRA-TIFR as a national project at a low cost of about 15 million US (1992) $. |
| Laboratory Virtual Instrumentation Engineering Workbench (LabVIEW) is a graphical programming environment based on the concept of data flow programming. This programming paradigm has been widely used for data acquisition and instrument control. There are three important components involved in test and measurement applications, namely data acquisition, data analysis and data visualization. |
NECESSITY OF MONITORING |
| Telescope is required to provide the necessary co-ordination between the various building blocks of the receiver system. Monitoring is also required to analyze power stability and interference in Radio Frequencies. This system is used for controlling the activities of the various building blocks of GMRT like Front End, Local Oscillator, Intermediate Frequency, Base Band, SERVO and Feed Positioning System etc and Monitor the healthiness of the same in each of the antenna shells and CEB. It provides the human interface to persons like Telescope Observers, Scientists and maintenance personnel for operating all the antennas from CEB. It has to monitor all parts of the telescope system for correct operation and alert the operator in case of any anomalous behavior. And in the case of severe fault conditions, safety procedures have to be initiated locally. It has also to prevent human error from placing the telescope in a dangerous situation. |
SYSTEM DESCRIPTION |
| The below figure shows the block diagram of the RF monitoring system. The system includes of 30 antennas each antenna consists of two channels i.e. total of 60 channels. Channel one of all antennas is connected to 1st optical receiver and similarly channel two of all antennas is connected to 2nd optical receiver. Optical receiver consists of a photo-diode which converts optical signal to electrical domain. |
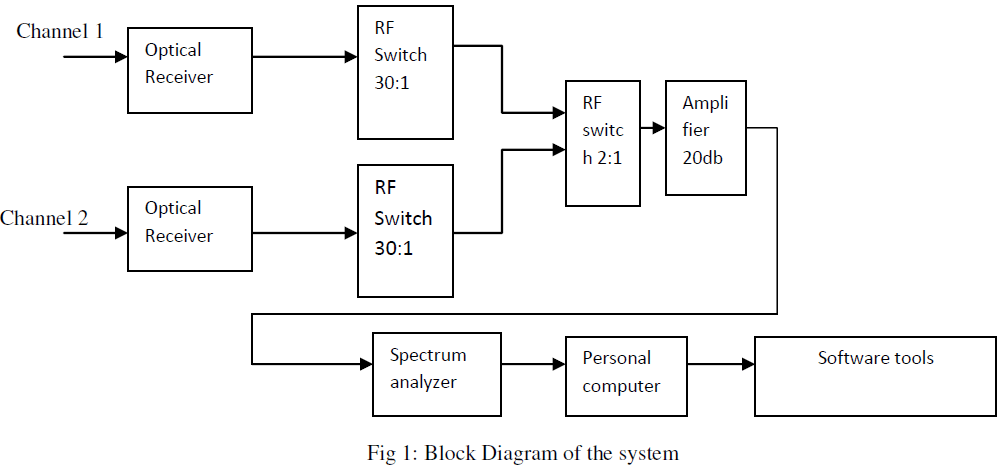 |
| Further the signals from these optical receiver is given to the 30:1 RF switch ,further these(CH1 and CH2) signals coming from the two 30:1 RF switches is again given to one 2:1 switch so as to get one signal at a particular time from the 60 signal from 30 antennas. Again this is giver to an amplifier of 20dB gain for improving signals strength. The IC used here is M3SWA for developing RF switch. This IC is used as it is having high isolation, which results in reducing interference between two power signals. To analyze the coming signal we feed it to the spectrum analyzer. Here, we communicate this spectrum analyzer with the personal computer (PC) using GPIB card, further we develop labview interface to monitor and store the selected signals |
RF SWITCH |
| An RF (Radio Frequency) and microwave switch is a device to route high frequency signal through transmission paths. RF and microwave switches are used extensively in microwave test systems for signal routing between instruments and devices under test (DUT). Incorporating a switch into a switch matrix system enables you to route signals from multiple instruments to single or multiple DUTs. This allows multiple tests to be performed with the same setup, eliminating the need for frequent connects and disconnects. The entire testing process can be automated, increasing the throughput in high-volume production environments. |
| Similar to electrical switches, RF and microwave switches come in different configurations providing the flexibility to create complex matrices and automated test systems for many different applications. The IC used to make this RF switch has a very high isolation to isolate the signals in a better way for analysis. |
SPECTRUM ANALYZER |
| The spectrum analyzer used here is of bench top type of Rhode and Schwarz-FSV. A spectrum analyzer measures the magnitude of an input signal versus frequency within the full frequency range of the instrument. The primary use is to measure the power of the spectrum of known and unknown signals. By analyzing the spectra of electrical signals, dominant frequency bandwidth, and other spectral components of a signal can be observed that are not easily detectable in time domain waveforms. These parameters are useful in the characterization of electronic devices, such as wireless transmitters. |
OPTICAL RECEIVER |
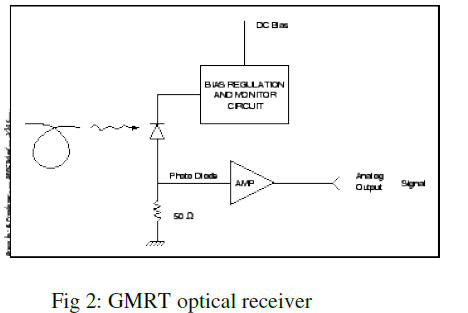
| Photo detection is the process of conversion from optical to electrical domain. A block diagram of the GMRT optical receiver is shown in figure. The basic detector is a reverse biased p-n junction diode. In this bias condition a reverse leakage current (the dark current) flows. The threshold for detection is determined by the dark current. The other important characteristic of a photo-detector is its responsivity R. The responsivity is a measure of the efficiency with which light is converted to electrical current and it is related to the width of the depletion region of the diode and to the spectral response of the receiver. A larger depletion region leads to a better responsivity. PIN diode detectors made of InGaAsP and grown on InP are popular photo-detectors as they have low dark currents and high responsivity. In the case of the GMRT, the detector used has a dark current of 5 nA and R of 0.8 mA/mW. |
 |
COMMUNICATION |
A. LabJACK communication: |
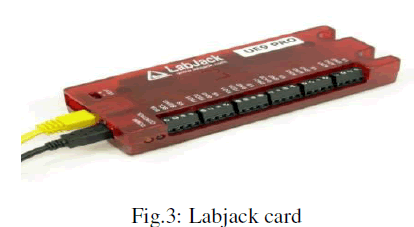
| The LabJack data acquisition modules are flexible I/O modules for getting signals in to and out from your computer. The family features wide software support with drivers and code examples for a range of platforms and languages. We are using LabJack UE9 module for switching networks. This module generates control bits for RF switch. The card can be connected via USB and Ethernet too. |
| Features: |
| * 14 Analog Inputs (12-16 Bits Depending on Speed) |
| * ±5 or 0-5 Volt Maximum Analog Input Range |
| * 2 Analog Outputs (12-Bit, 0-5 Volts) |
| * 23 Digital I/O * Up to 2 Counters (32-Bits Each) |
| * Up to 6 Timers (Pulse Timing, PWM Output, Quadrature Input) |
| * Supports Software or Hardware Timed Acquisition |
| * Capable of Command/Response Times As Low As 1.2 Milliseconds |
| * Built-In Screw Terminals for Some Signals |
| * USB 2.0/1.1 Full Speed Interface |
| * Dual-Processor Design with 168 MHz of Total Processing Power |
| * Electrical Isolation Possible with Ethernet Interface |
| * No Power Supply Needed for USB Operation. |
 |
| DAQ (Data acquisition) card is control and monitoring card which is design to enhance the capability of Labjack card. The 14 user accessible analog I/P i.e. Analog channel are increased to112channels by using 8 channel analog multiplexer. The bit selections of multiplexer are controlled by 3 digital bits (MI/O0-MI/O2). |
| LabJack card are USB/Ethernet based measurement and automation devices which provide analog inputs/outputs, digital inputs/outputs, and more. It is a multipurpose card which having 16 analog I/P channel, 23 Digital I/O channels and 2 DAC ports. Communication to labjack card can be done by USB and Ethernet. The main function of labjack card is to read the output of sensors which measure voltage, current, power, temperature, humidity, wind speed, force, pressure, strain, acceleration, RPM, light intensity, sound intensity, gas concentration, position, and many more. A LabJack brings this data into a PC where it can be stored and processed as desired. In our application it read the output voltage of photodiode detector through the DAQ card. Here we are using UE9 PRO Labjack card. |
| Command/response (software timed) reads/writes typically take 1.5-4.0 ms depending on communication configuration. The digital inputs can also be read in a hardware timed input stream where up to 16 inputs count as a single stream channel. The remaining digital I/O channels are used to control the filter selection bits in receiver to continuously monitor the broad band RF channels this bits is given to latch IC to hold the values till the latch Enable value change. One of the digital bits from EIO channel is used to toggle the latch enable. It will be use in RF monitoring system. |
| The latch IC used for this purpose is MC74HC573N. It is an octal non–inverting buffer/line driver/line receiver designed to be used with 3–state memory address drivers, clock drivers, and other bus–oriented systems. |
LABVIEW DEVELOPMENT |
| Virtual instrumentation is an interdisciplinary field that merges sensing, hardware and software technologies in order to create flexible and sophisticated instruments for control and monitoring applications. The flexibility is possible as the capabilities of a virtual instrument depends very little on dedicated hardware – commonly, only application specific signal conditioning module and the analog-to-digital converter used as interface to the external world. Therefore, simple use of computers or specialized onboard processors in instrument control and data acquisition cannot be defined as virtual instrumentation. We are developing a labview interface to achieve three major goals which are: |
| i) For switching the channels as per requirement |
| ii) To analyze the power in dBm (decibel meter) |
| iii) To create a graphical user interface. |
| For developing the above tasks in labview we are using a licensed version of labview 8.2 from National Instruments. Signals are transferred from spectrum analyzer through GPIB (General Purpose Interface Bus) to LabVIEW. Then these signals are fetched by drivers of spectrum analyzer provided by NI. |
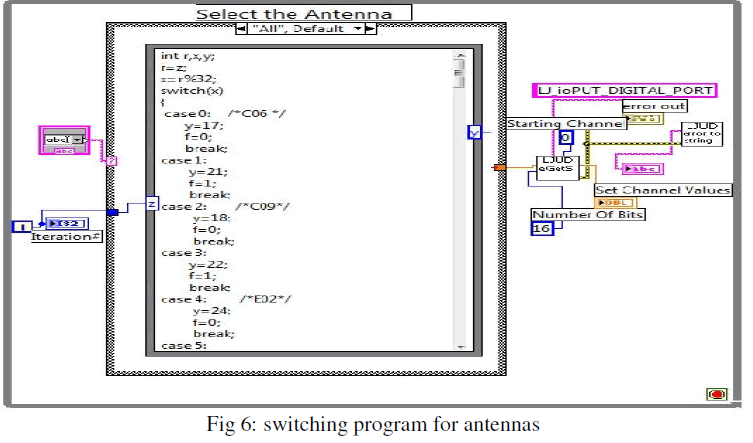
| As we are monitoring 2 channels simultaneously out of 60 channels, to select required channels we generate control bits through LabJack Card which are given to RF switch. Then RF switch selects the particular channels. |
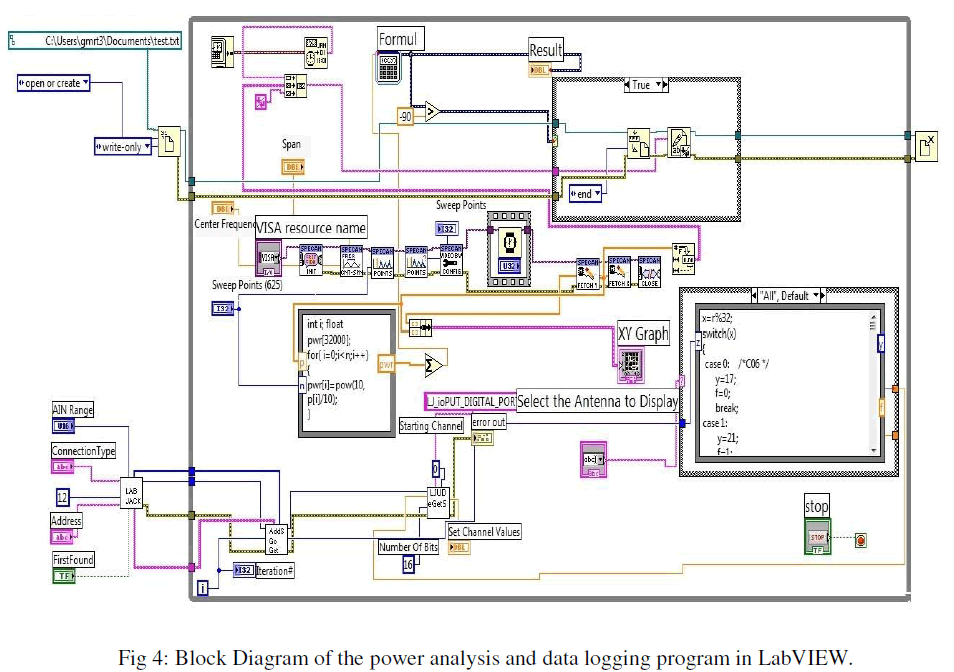 |
| Data coming from spectrum analyzer consist of X axis as frequency and Y axis as respective power level. To calculate the total band power, we first convert received power in dBm to mwatts. Then addition of the power at each sweep point is calculated to get the total band power. Further the power is converted into dBm from Watts using the following equation: |
| P=10 log (Pin / 1mW) |
| Where, P= power in dBm |
| Pin= power in Watts. |
| Now the resultant band power is compared with specific threshold value, if it exceed the threshold then the whole band is stored in a text file with respective time and date. This is done using Case Structure tool of LabVIEW. |
| In this program the drivers of the spectrum analyzer are used to fetch the data i.e. the x-axis and y-axis. There is also a threshold set to detect the signal which goes beyond it and it is further stored in the text file. |
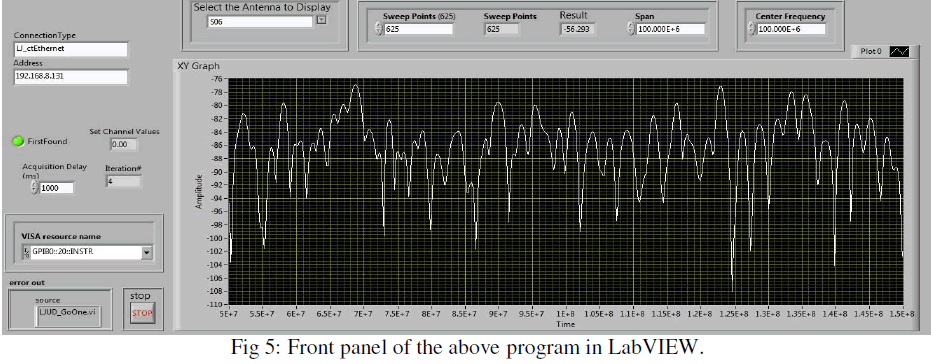 |
Switching program for channels: |
| This is a program developed in C language for switching between the 60 channels of 30 antennas. To monitor the power level of each channel . We have used a formula node tool of LabVIEW to implement it. |
 |
RESULTS AND DISCUSSION |
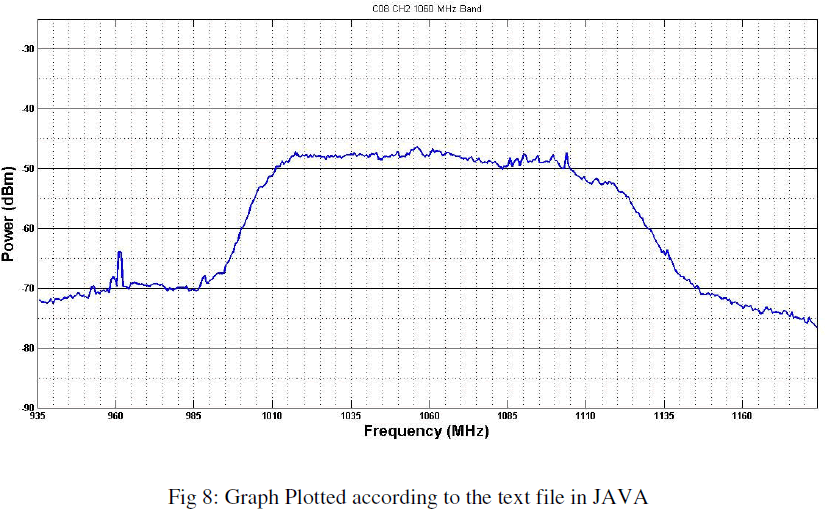
| In this the data is retrieved by using JAVA language. Here it is first read from the text file generated through LabVIEW in which the data is stored. Further it plots the required graph according to the power levels. The graph is plotted with X-axis as frequency and Y-axis as power. In this we are supposed to give the desired date and time, then the respective data is plotted. The below figure shows the text file which is stored by using LabVIEW. It gives total power of signal as per the given threshold value. The text file is written in format which shows the channel, antenna name, date and time of respective power levels of whole band. |
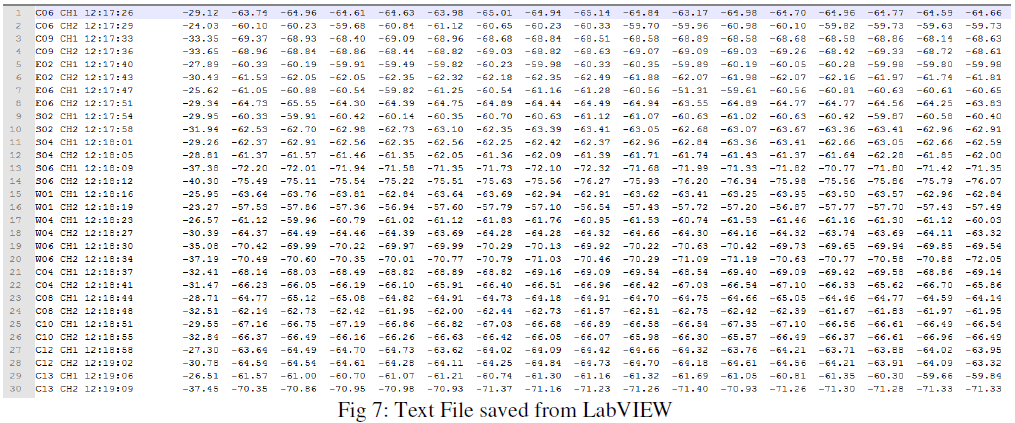 |
| Further we use this stored data for data analyzing by retrieving it using Java. Using this program we can feed the date and time and we get required graph of particular band stored at that time. This particular data base is used by astronomers and scientist for their astrophysical research. |
 |
CONCLUSIONS AND FUTURE SCOPE |
| Main purpose of this project is to indentify different sources of RF interferences occurring in whole field of the system. |
| We can also detect the source of the interference by continuously monitoring, and if it is not working in the allocated band we can ask the respective source to change its band. |
| This data is further used for analyzing in astrophysical research. |
| Another future scope of this project is to develop a web based tool which can be accessed by authorized person anywhere in world. |
ACKNOWLEDGEMENT |
| We would like to gratefully and sincerely thank Dr. Suresh Kumar for giving us opportunity to work with project National Centre for Radio Astrophysics-GMRT and for his guidance throughout the project. We would also like to thank Mr. Pravin Raybole and Sanjeet Rai for their mentorship which was a paramount in providing a well rounded experience with the project. We would like to thank the members in RFI lab and GMRT for letting us work with the equipments needed for our experimentation and giving us support. We extend our thanks to our Head of the Department Prof. N.M Karajanagi for his guidance. |
References |
|