ISSN ONLINE(2278-8875) PRINT (2320-3765)
ISSN ONLINE(2278-8875) PRINT (2320-3765)
M.Anbarasan1, K.Latha2
|
| Related article at Pubmed, Scholar Google |
Visit for more related articles at International Journal of Advanced Research in Electrical, Electronics and Instrumentation Engineering
Fuel cell as a renewable energy source is considered to be one of the most promising sources of electrical power. The characteristics of fuel cell is such that the DC power extracted from it is at low voltage level, this paper proposes a prototype of a power electronics based fuel cell emulator. It can effectively replace a real electrochemical fuel cell stack. The power stage of this new fuel cell emulator consists of a dc-to-dc buck converter. The emulator interfaced with boost converter and simulated using MATLAB/SIMULINK. The fuel cell emulator performance was evaluated for changes in fuel flow rate and load, and the simulation matched with the experimental results. In this thesis a new MPPT algorithm is proposed, the step size is automatically tuned according to operating point and it is eventually tuned to zero.
Keywords |
| MPPT-Maximum Power Point Tracking, FCE-Fuel cell emulator. |
INTRODUCTION |
| Fuel cells are now on the verge of being introduced commercially, revolutionizing the way we presently produce power. Fuel cells can use hydrogen as a fuel, offering the prospect of supplying the world with clean, sustainable electrical power. Fuel cells have been called as the “microchip of the hydrogen age,” this clean renewable energy source is seen as alternative to fossil fuel used in running world’s economy. As a matter of fact, the Fuel Cell System (FCS) needs several auxiliary components in order to work properly. On the other hand the price of the fuel cell stack, the cost of the pure hydrogen and the life time of fuel cell stack is determined by the number of hours of use. All the above issues call for the use of a low cost device which can behave electrically like the real FCs, but whose testing is not risky. These systems are called emulators. |
| A boost converter based maximum power point tracking (MPPT) of FCS using Resistance matching method is proposed in order to extract the maximum available power from the FCS at all conditions. This technique is verified on the Fuel Cell Emulator (FCE). Here, the FCE is used as a replacement for actual FCS thus saving cost and energy. After the successful working of the MPPT based boost converter, it can be directly connected with the actual FCS to obtain maximum power output. |
FUEL CELL EMULATOR |
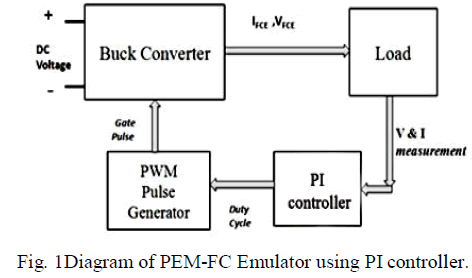
| The FCS emulator that was implemented by a Chopper, in particular a classical DC–DC buck converter. A switching DC–DC buck converter has been chosen, operated at a constant switching frequency and a constant input DC voltage Vs, while the output DC voltage Vo is obtained by varying the converter duty cycle . The Fig.1 shows the block diagram of a PEM-FC Emulator using PI controller proposed in this paper. The goal of this emulator is to reproduce the PEM-FC model desired. The emulator mainly consists of a DC-DC converter and a control system. The buck converter is working mostly in activation and ohmic regions. By sensing the voltage and current of the buck converter, find the resistance of the load. . The look-up table used here has the values of resistances and corresponding voltage for various fuel flow rates corresponding to the V-I characteristics of a particular PEMFC stack to be emulated. Depending upon the fuel flow rate and the load resistance, a suitable voltage is chosen from the look-up table, this voltage is set as reference voltage, the actual value measured from the circuit and reference voltage is given to the PI controller. The PI controller controls the duty ratio of the switch, such that the output of the buck converter will follow the PEM-FC stack V-I characteristics |
 |
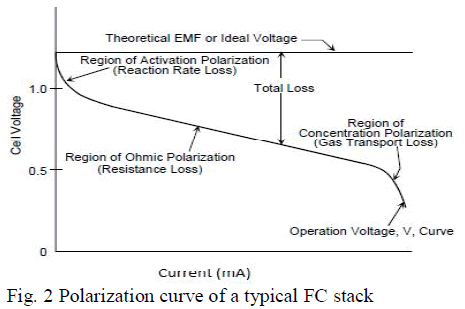 |
| This emulator emulates the activation and ohmic regions of the required polarization curve. Concentration region is eliminated in this region, because the voltage drops steeply and the buck converter has to be operated in low duty cycles. This affects the efficiency of the converter and produce electromagnetic interference problems. Fig. 3 shows the electrical scheme of the buck converter. |
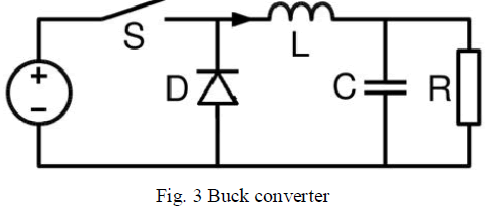 |
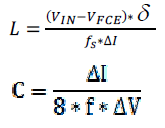
| A power MOSFET based DC-DC buck converter with switching frequency fs = 20 KHz has been chosen. The design of the converter output filter has been carried out on the basis of the following conditions: |
| i. The components of the converter are ideal. |
| ii. Continuous inductor current mode is assumed. |
| iii. Parasitic resistances are ignored. |
| The above conditions lead to, |
 |
MAXIMUM POWER POINT TRACKING |
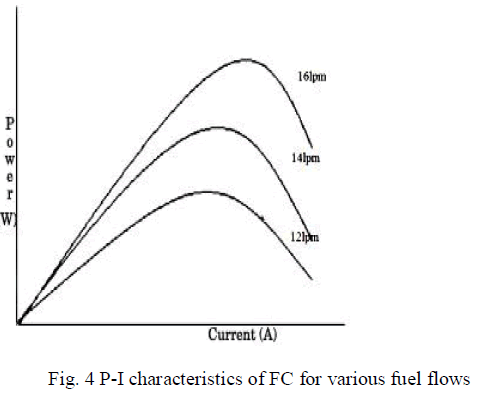
| Ability of FC systems to produce power is limited. So it is necessary to force the system to operate in conditions which correspond to the Maximum Power Point (MPP) of the FC. In general, a FCS is operated in conjunction with a dc–dc power converter, whose duty cycle is modulated in order to track the instantaneous MPP of the FCE. On the P-I characteristics of a FC Stack, shown in Fig. 4 exists only one MPP for a particular fuel flow |
 |
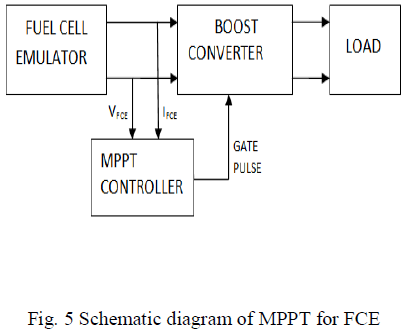 |
| A boost converter is placed in between the FCE and the resistive load. Fig. 5 shows the schematic diagram of the MPPT process. By changing the duty cycle of the boost converter, the net impedance seen by the FCE is changed. If the load impedance is equal to the output impedance of the FC at its MPP, the maximum power would be delivered from the FC. Thus the proposed MPPT algorithm controls the duty cycle of the boost converter, which would force the FCE to deliver its maximum power. In general, a FCS is operated in conjunction with a dc–dc power converter, whose duty cycle is modulated in order to track the instantaneous MPP of the FC source. |
A. RESISTANCE MATCHING ALGORITHM |
| MPPT controller implements the resistance matching algorithm. The emulator system used here is of low power rating and hence the method of Incremental Conductance more difficult to implement. Also, it is sufficient enough that the resistance matching algorithm is implemented for the fuel cell system. A drawback of P&O MPPT technique is that, at steady state, the operating point oscillates around the MPP giving rise to the waste of some amount of available energy. |
| Several improvements of the P&O algorithm have been proposed in order to reduce the number of oscillations around the MPP in steady state. |
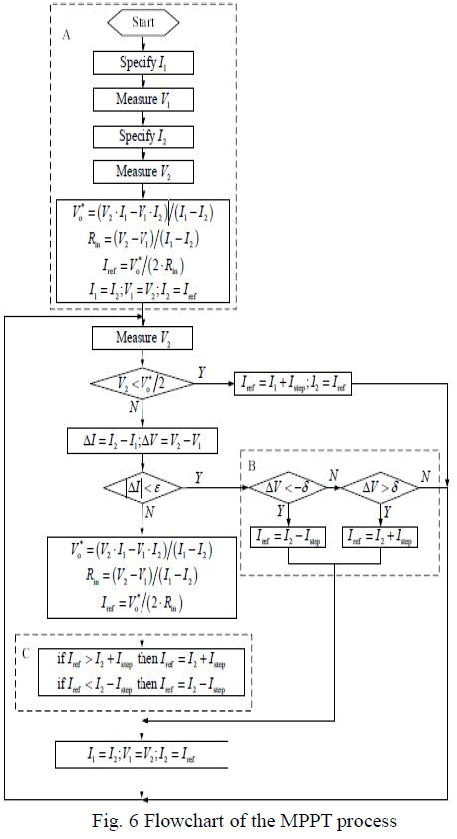 |
| The Resistance matching method is used to find a effective way to improve tracking accuracy and to overcome the drawbacks in traditional MPPT algorithms. The flowchart of the modified Resistance matching method algorithm is shown in Fig. 6. In general, the MPP of FC can exist in the ohmic or the concentration polarization region depending on its design and operating conditions. For general usability, the algorithm is designed to account for both cases by switching between two operating modes. In the proposed algorithm, it is always initialized by assuming that the MPP exists in the ohmic polarization region and the location of the MPP is predicted by using the classical maximum power transfer theory. If the assumption is proven invalid, the algorithm then switches to the second mode and the MPP is located in a step-wise manner through a progressive search. The flowchart of the algorithm is depicted in Fig 6. |
| The Resistance matching method is used to find a effective way to improve tracking accuracy and to overcome the drawbacks in traditional MPPT algorithms. The flowchart of the modified Resistance matching method algorithm is shown in Fig. 6. In general, the MPP of FC can exist in the ohmic or the concentration polarization region depending on its design and operating conditions. For general usability, the algorithm is designed to account for both cases by switching between two operating modes. In the proposed algorithm, it is always initialized by assuming that the MPP exists in the ohmic polarization region and the location of the MPP is predicted by using the classical maximum power transfer theory. If the assumption is proven invalid, the algorithm then switches to the second mode and the MPP is located in a step-wise manner through a progressive search. The flowchart of the algorithm is depicted in Fig 6. |
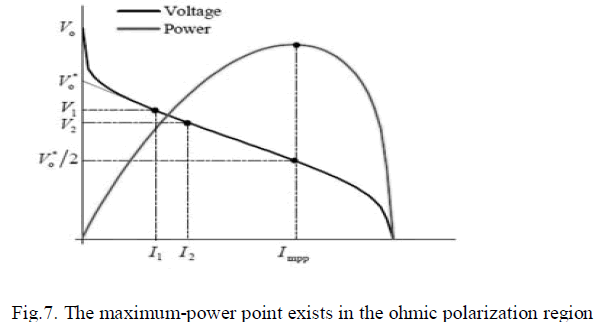 |
| Fig. 7 shows that, when the PEM-FC is controlled to operate at two adjacent output currents, I1 and I2 (> I1), both taken in the ohmic polarization region, and the corresponding output voltages, V1 and V2, are measured, the equivalent voltage source and internal resistance Rin can be computed from equation (3) and (4), respectively. Hence, for maximum power transfer, the FC output current should be regulated at Iref as computed from equation (5) by adjusting the input current of the boost converter. If Iref exists in the ohmic polarization region, the MPP is tracked after one computational step. |
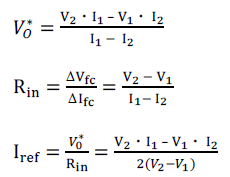 |
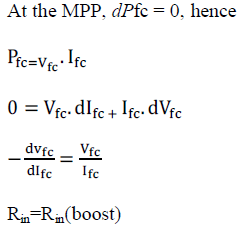
| Since the condition Rload = Rin generally holds for maximum power transfer, a progressive search based on resistance matching is required to locate the MPP. In this case, an attempt to operate the FC at Iref computed from equation (5) will cause the output voltage to fall below a threshold value Vmin, which implies that the MPP exists outside the ohmic polarization region and a progressive search is required. To proceed further, I2 is first restored to (I1 + Istep), followed by a convergence towards the MPP through a successive addition of Istep. When the true MPP is within ± Istep from I2, the advancement step is not performed, The the target area is initiated through an iterative refined estimation of Iref by equation (5) and the substitutions I2 → I1 and Iref → I2 until a predefined accuracy is reached. At this state, the MPP is found and the algorithm exits to Box B, which is designed to track the MPP under dynamic changes of operating conditions (to be discussed in Subsection B in flowchart). |
| When a fixed Istep is used, the tracking accuracy can be improved by decreasing the step size but this is done at the penalty of reduced convergence speed. Besides, the choice of ∈ must be carefully matched to the adopted step size since a fine step is required to achieve a high accuracy. If the search fails to meet the predefined accuracy, it is likely to persist indefinitely and I2 will tend to oscillate about the true MPP at steady state. This can be avoided by adopting a variable step size that is made proportional to the difference between the PEM-FC’s internal resistance Rin and the boost converter’s input resistance Rin(boost). |
 |
| The variable step size Istep is formulated as given by equation (12). In practice, the proportionality constant k is a parameter to be tuned for an optimal tracking trajectory. |
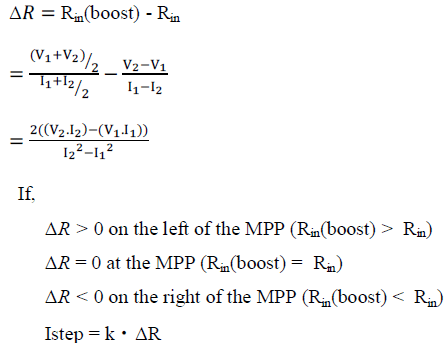 |
| With this formulation, a large step size is produced when the existing operating point is far from the MPP and it is naturally reduced to zero when the MPP is reached, therefore a fast convergence and a high accuracy are both achievable. since the step size is eventually reduced to zero, in theory the predefined accuracy is always satisfied hence oscillatory behavior is not present. Finally, a correct sign is naturally generated for Istep according to equation |
 |
| In most applications, the MPPT is achieved by connecting a power conditioner dc/dc converter between the FCS and load. To simplify the control system the FCS operation point is employed to directly control the converter duty cycle based on a Pulse Width Modulation (PWM). After the successful working of the MPPT based boost converter, it can be directly connected with the actual Fuel Cell Systems (FCS). |
BOOST CONVERTER |
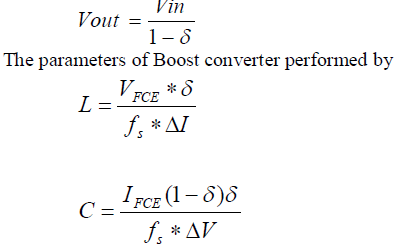
| By changing the duty cycle of the boost converter, the fixed load of the FCE is converted into a variable load. The equivalent output resistance (Req) of the FCE can be calculated as, |
| The above equation is derived under ideal conditions. From that it is evident that the MPPT is possible with the boost converter if the load resistance R is greater than Req. Otherwise the converter settles to a duty cycle at which the power output from the FCE is lower than the maximum expected value and the output voltage is then given by. |
 |
SIMULATION RESULTS |
A.FC EMULATOR |
| TABLE 1 PARAMETERS OF BUCK CONVERTER |
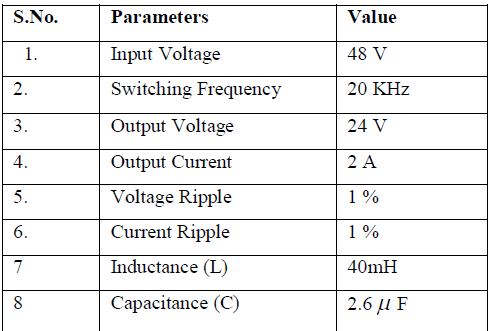 |
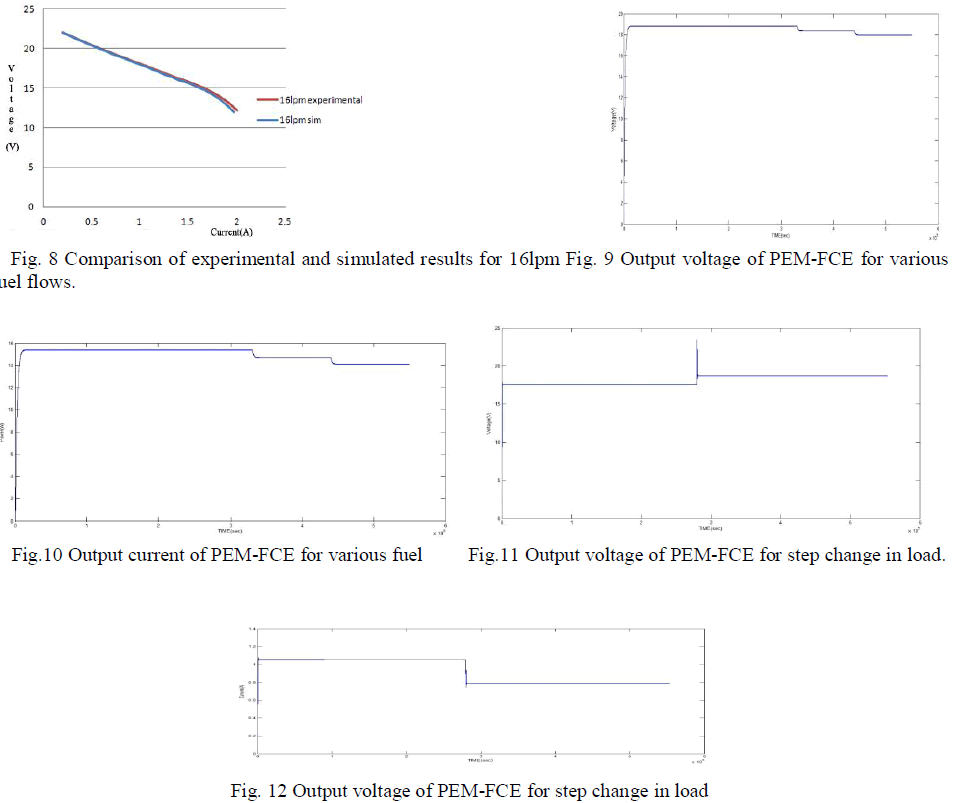
| TABLE 1 shows the parameters of buck converter, Fig. 8 shows the comparison of experimental and simulated results of 16lpm, Fig. 9 and Fig 10 shows the Output voltage |
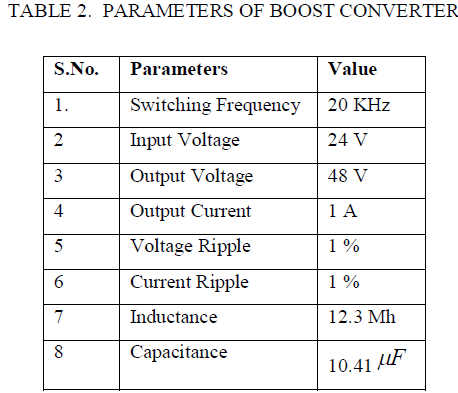
| current of PEM-FCE for various fuel flows 16lpm,14lpm,12lpm. Fig 11 and Fig 12 shows the output voltage and current of PEM-FCE for step change in load from 10Ω to 15Ω. Table 2 shows the parameters of Boost converter. Afterr the integration of Boost converter with FCE, Fig 13 shows the output voltage current and power when change in duty ratio of boost converter from 0.55 to 0.65. |
 |
 |
INTEGRATION OF BOOST CONVERTER WITH FCE |
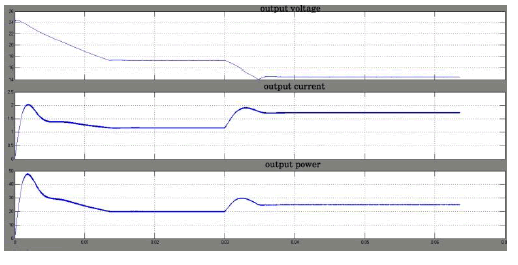 |
| Fig.13 Output waveform of voltage current and power when Change in duty ratio of boost converter from 0.55 to 0.65. |
CONCLUSION |
| Fuel Cell Emulator was designed for 50W. The Fuel Cell Emulator performance was evaluated for changes in fuel flow rate and change in load. The interfacing of Fuel Cell Emulator with the boost converter model was carried out using MATLAB SIMULINK. For different values of duty ratio of the boost converter the respective outputs of the Fuel Cell Emulator matches with the actual Fuel Cell values. In open loop by changing the duty ratio of boost converter the Maximum Power Point is obtained. |
References |
|