ISSN ONLINE(2319-8753)PRINT(2347-6710)
ISSN ONLINE(2319-8753)PRINT(2347-6710)
R.Gunachitra, Mr.D.Suresh
|
| Related article at Pubmed, Scholar Google |
Visit for more related articles at International Journal of Innovative Research in Science, Engineering and Technology
Resolution enhancement (RE) schemes (which are not based on wavelets) suffer from the drawback of losing high frequency contents (which results in blurring). Here we propose the Adaptive wavelet- transform-based (AWT) for resolution Enhancement in satellite images. A satellite input image is decomposed by DT-CWT (which is nearly shift invariant) to obtain high-frequency sub bands. The high-frequency sub bands and the lowresolution (LR) input image are interpolated using the Lanczos interpolator. The high frequency sub bands are passed through an NLM filter to cater for the artifacts generated by DT-CWT (despite of its nearly shift invariance). The filtered high-frequency sub bands and the LR input image are combined using inverse DT-CWT to obtain a resolution-enhanced image.We propose DWT for sub band interpolation process and we compare the resolution of satellite image enhancements using Wavelet Methods with ARSIS methods.
Keywords |
| Dual-tree complex wavelet transform (DTCWT), Lanczos interpolation, resolution enhancement (RE), shift variant, PAN sharpening methods,ATWT,MTF. |
INTRODUCTION |
| RESOLUTION (spatial, spectral, and temporal) is the limiting factor for the utilization of remote sensing data (satellite imaging, etc.). Spatial and spectral resolutions of satellite images (unprocessed) are related (a high spatial resolution is associated with a low spectral resolution and vice versa) with each other [1]. Therefore, spectral, as well as spatial, resolution enhancement (RE) is desirable. |
| Interpolation has been widely used for RE [2], [3]. Commonly used interpolation techniques are basedon nearest neighbors (include nearest neighbor, bilinear, bicubic, and Lanczos). The Lanczos interpolation (windowed form of a sinc filter) is superior than its counterparts (including nearest neighbor, bi linear, and bi cubic) due to increased ability to detect edges and linear features. It also offers the best compromise in terms of reduction of aliasing, sharpness, and ringing [4]. Methods based on vector-valued image regularization with partial differential equations (VVIR-PDE) [5] and in painting and zooming using sparse representations [6] are now state of the art in the field (mostly applied for image in painting but can be also seen as interpolation).RE schemes (which are not based on wavelets) suffer from the drawback of losing high-frequency contents (which results in blurring). |
| RE in the wavelet domain is a new research area, and recently, many algorithms [discrete wavelet transform (DWT) [7], stationary wavelet transform (SWT) [8], and dual-tree complex wavelet transform (DT-CWT) [9] have been proposed [7]–[11]. An RE scheme was proposed in [9] using DT-CWT and bi cubic interpolations, and results were compared (shown superior) with the conventional schemes (i.e., nearest neighbor, bilinear, and bi cubic interpolations and wavelet zero padding). More recently, in [7], a scheme based on DWT and bicubic interpolation was proposed, and results were compared with the conventional schemes and the state-of-art schemes (wavelet zero padding and cyclic spinning [12] and DTCWT [9]). Note that, DWT is shift variant, which causes artifacts in the RE image, and has a lack of directionality; however, DT-CWT is almost shift and rotation invariant [13]. |
| DWT-based RE schemes generate artifacts (due to DWT shift-variant property). In this letter, a DT-CWTbased nonlocal-means-based RE (DT-CWT-NLM-RE) technique is proposed, using the DT-CWT, Lanczos interpolation, and NLM. Note that DT-CWT is nearly shift invariant and directional selective. Moreover, DTCWT preserved the usual properties of perfect reconstruction with well-balanced frequency responses [13], [14]. Consequentially, DT-CWT gives promising results after the modification of the wavelet coefficients and provides less artifacts, as compared with traditional DWT. Since the Lanczos filter offer less aliasing, sharpness, and minimal ringing, therefore, it a good choice for RE. NLM filtering [15] is used to further enhance the performance of DT-CWT-NLM-RE by reducing the artifacts. The results (for spatial RE of optical images) are compared with the best performing techniques [5],[7]–[9]. |
II. PRELIMINARIES |
A. NLM Filtering |
| The NLM filter (an extension of neighborhood filtering algorithms) is based on the assumption that image content is likely to repeat itself within some neighborhood (in the image) [15] and in neighboring frames [16]. It computes denoised pixel x(p, q) by the weighted sum of the surrounding pixels of |
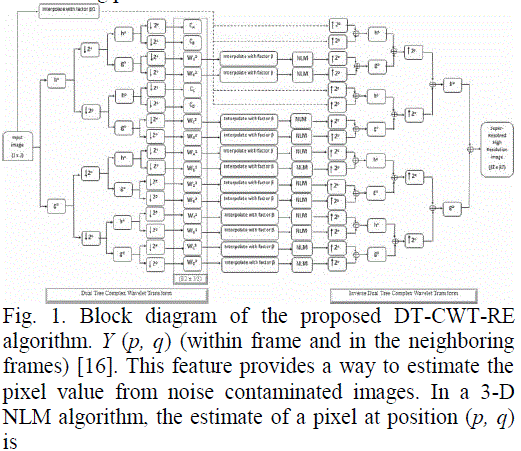 |
| Fig. 1. Block diagram of the proposed DT-CWT-RE algorithm. Y (p, q) (within frame and in the neighboring frames) [16]. This feature provides a way to estimate the pixel value from noise contaminated images. In a 3-D NLM algorithm, the estimate of a pixel at position (p, q) is |
 |
| wheremis the frame index, and N represents the neighborhood of the pixel at location (p, q). K values are the filter weights, |
 |
| where V is the window [usually a square window centered at the pixels Y (p, q) and Y (r, s)] of pixel values from a geometric neighborhood of pixels Y (p, q) and Y (r, s), σ is the filter coefficient, and f(.) is a geometric distance function. K is inversely proportional to the distance between Y (p, q) and Y (r, s). |
A. NLM-RE |
| RE is achieved by modifying NLM with the following model [17]: |
 |
| Lm is the vectorized low-resolution (LR) frame, I is the decimation operator, J is the blurring matrix, Q is the warping matrix, X is the vectorized high-resolution (HR) image, and n denotes the Gaussian white noise. The aim is to restore X from a series of L. Penalty function _ is defined as |
 |
| where R is a regularization term, λ is the scale coefficient, x is the targeted image, and Ym is the LR input image. In [17], the total variation kernel is chosen to replace R, acting as an image deblurring kernel. To simplify the algorithm, a separation of the problem in (4) is done by minimizing |
 |
| where Z is the blurred version of the targeted image, and Om is the weight matrix, followed by minimizing a deblurring equation [11], i.e., |
 |
| A pixelwise solution of (5) can be obtained as |
 |
| DT-CWT-RE. (i) Proposed DT-CWT-RE. (j) Proposed DT-CWT-NLM-RE. Where the superscript r refers to the HR coordinate. Instead of estimating the target pixel position in nearby frames, this algorithm considers all possible positions where the pixel may appear; therefore, motion estimation is avoided [11]. Equation (7) apparently resembles (1), but (7) has some differences as compared with (1). The weight estimation in (2) should be modified because K’s corresponding matrix O has to be of the same size as the HR image. Therefore, a simple up scaling process to patch V |
 |
| process to patch V is needed before computing K. The total number of pixel Y in (7) should be equal to the number of weights K. Thus, a zero-padding interpolation is applied to L before fusing the images [11]. |
I. PROPOSED IMPLEMENTATION |
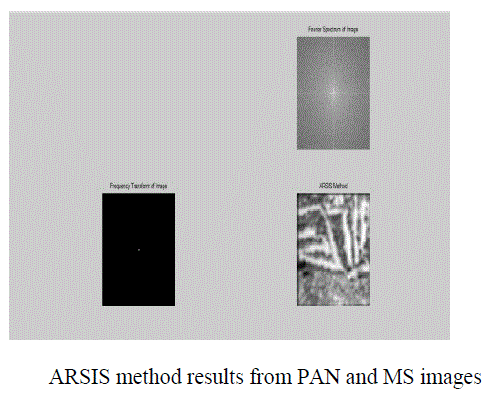
| The ARSIS-based methods are inherently built to respect the consistency property. Consequently, the present work focuses on the synthesis property. This property has been expressed in general terms [11], [13], [15], [16]. We propose here a precise definition of the synthesis property in terms of geometry: The restitution of the spatial organization of the radiometry in the observed landscape by the synthesized image should be as identical as possible to the organization that the corresponding sensor would observe with the highest spatial resolution, if existent. |
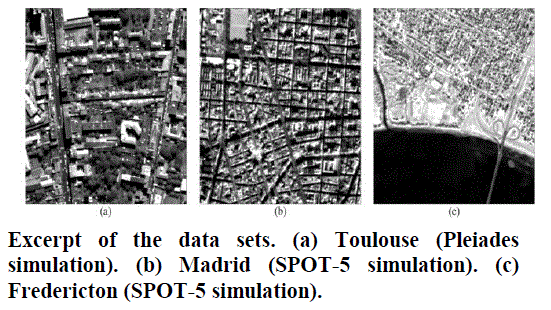
| The work presented here aims at including the difference in MTF between PAN and MS images into an existing ARSIS- based fusion method in order to demonstrate that taking into account this difference leads to a better respect of the synthesis property from the geometrical point of view without degrading the quality of the other aspects of the synthesized images. The fusion method used in this demonstration is the method ATWT-M3, where ATWT denotes the MSM and means âÃâ¬Ãâ¢à trousâÃâ¬Ãâ (with holes) wavelet transform, which is an un-decimated transform, and M3 is the IMM described by [12], [13], and [19]. The HRIMM is identical to the IMM as in most published works. This method has been shown to provide good results in most cases. It is rather simple and allows the assessment of the impact resulting from the MTF adaptation. While the results will not be the same than those obtained here, our method for accounting for the difference in MTF may easily apply to other ARSIS-based methods. The MTFs for the four MS channels of the Pleiades sensor, and that for the PAN, It is function of the spatial frequency normalized by the sampling frequency of the PAN image. Consequently, the relative Nyquist frequency for PAN is 0.5 and that for MS is 0.125. The spatial resolution of the PAN image (70 cm) is four times better than that of the MS image (280 cm). The MTFs mainly account for detector performances and blurring since the MTF for eachMSisalmost qual to zero for relative frequencies close to 0.25. It means that onecannotdistinguishdetailslessthan280cminsizeintheMS images. |
| On the contrary, the MTF of PAN is large equal to 0.4—for this frequency, and such details are highly visible. The difference in MTF between low- and highspatial- resolution images is evidenced in this figure: The MTF of MS has a sharper decrease with frequency than that of PAN. According to the synthesis property, the synthesized images should exhibit the typical MTF of real images at this resolution. However, without modification of the MTF during the fusion process, the resulting MTF exhibits a discontinuity as shown in broad dash in Fig. 4. In this figure are drawn the schematic representations of the MTF for the following: 1) the LR; 2) the HR; and 3) the synthesized image without modification of the MTF. The curves for the MTF at LR and HR are similar to those for MS and PAN One can see the discontinuity in the MTF of the synthesized image for the relative frequency equal to 0.125. Below this value, the MTF is similar to that of the MS at LR. Above this value, the MTF is similar to that of an HR image. Such a discontinuity should not exist if the synthesis property were to be respected. Its existence explains partly the several artifacts observed in synthesized images. It also illustrates the expected benefit of taking into account the difference in MTF during the fusion process. In an illustrative way of speaking, we can say that the solution consists in âÃâ¬Ãâ¢raisingâÃâ¬Ãâ the MTF of the MS frequencies in the range [0, 0.125] so that it is close to that of an HR image. Doing so provides an MTF closer to a âÃâ¬Ãâ¢realâÃâ¬Ãâ MTF and similar contrast in the image for the same frequency without considering its origin: PAN or MS. It is an adaptation of the original LR MTF of MS images to an HR MTF for the synthesized images. This is why we will use the term âÃâ¬Ãâ¢MTF adaptation.âÃâ¬Ãâ |
 |
| A new measure, i.e., the MTF normalized deviation MTFdev, has been proposed to evaluate the performances of a fusion method with respect to the synthesis property expressed in terms of geometry. It highlights strengths and weaknesses in the MTF of the synthesized image. This measure has been used here in the case of simulation of images. It could be used in the general case where no reference image is present at HR to assess the synthesis property . One conclusion of our work is that the degradation of resolution should take the MTF into account in an accurate way as done in the pioneering work [24]. |
| We have demonstrated that taking into account the difference in MTF between MS and PAN images leads to synthesized images of better quality. This work can be applied to other concepts and not only to ARSIS [16]. It could be interesting to observe the difference of behavior of this technique depending on the concept it is applied on. The MTF normalized deviation is one means of observation. We have shown how the difference in MTF between LR and HR can be taken into account into a âÃâ¬Ãâ¢standardâÃâ¬Ãâ fusion method based on the ARSIS concept. We have observed for three cases a better restitution of the geometry and an improvement in all indices classically used in quality budget in pan sharpening. These results demonstrate the following: 1) the benefit of taking into account the MTF in the fusion process and 2) the value of our method for MTF adaptation. An improvement is also observed in the case of noisy images, although the SNR is decreased by the MTF adaptation. |
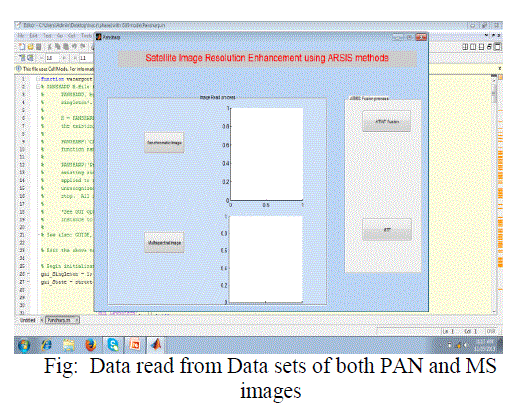
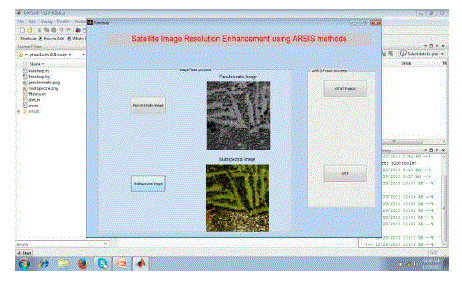
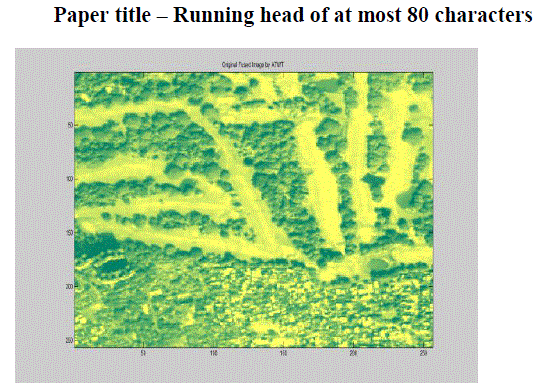
IV. RESULTS AND DISCUSSION |
 |
 |
 |
 |
V.CONCLUSION |
| We also evaluate the impact of the degree of the spline function used to resample images. We observed that the higher the degree, the better the MTF of the fused image. The difference is noticeable for low degree and becomes negligible when the degree is greater than four. We show that pansharpening methods benefit from the use of MTF. Reference [36] also shows that quality assessment benefits from the consideration of the MTF. The pansharpening context (method and quality assessment) seems to be insepara-ble from the use and consideration of the MTF.Although this study is quite limited in methods and data, thepresent results are encouraging and may constitute a new way to improve the restitution of geometrical features by already efficient fusion methods. |
References |
|