ISSN ONLINE(2319-8753)PRINT(2347-6710)
ISSN ONLINE(2319-8753)PRINT(2347-6710)
R. Bhattacharya1, S. Pal2, G. Biswas2, S. Karmakar2, G. Saha3
|
| Related article at Pubmed, Scholar Google |
Visit for more related articles at International Journal of Innovative Research in Science, Engineering and Technology
Seasonal changes of weather parameters are the factors in urban environments which affect thermal comfort. It was reported that solar radiation may change the ambient temperature upto 4°C. Annual variation of temeprature and global radiation follow similar pattern. Object of our work is to point out the seasonal distribution of thermal stress over Kalyani. Thermohygrometric index, Wet bulb globe temperature and Relative strain index are estimated for the period 1994 to 2012 with some data gap. WBGT and RSI are widely used for outdoor workers. A regional based scale of WBGT and RSI are developed with reference to THI over Kalyani. However an integrated approach including the behavioral adjustment and clothing insulation of a person along with other parameters to compute stress indices may give better results to identify zone of thermal comfort.
Keywords |
| Heat stress; Thermohygrometric index; Wet bulb globe temperature; Relative strain index |
INTRODUCTION |
| Outdoor workers are frequently exposed to solar radiation causing severe environmental heat stress which can deteriorate work efficiency and threaten health [1]-[4]. Air temperature, relative humidity, direct solar radiation and air flow are the four major variables of human thermal comfort which is defined as “condition of mind which expresses satisfaction with the thermal environment’’ [5]. In addition it also depends on heat exchange between body and the surrounding environment and clothing insulation [6]. Thermal comfort is different for different seasons. In winter the comfort temperature ranges from 20oC-25oC whereas in summer 23oC-27oC. However comfort depends on both climatic parameters and behavioral adjustment of human. Mathematically it is expressed by the following equation |
| (M+Q) + R ± C – E = ± S …(i) |
| M = Metabolic rate, Q = Incoming solar irradiance, R = Terrestrial radiation, C = Convection, E = Evaporation, S = Body temperature, for thermal comfort S = 0 Moreover indices of thermal discomfort of human are the result of the superposition of several components and are based on heat balance equation which integrate all environmental parameters. However it is practically impossible to record all the necessary variables of the heat balance. In reality the prevailing conditions are same at various working places. According to WMO discomfort starts provided ambient air temperature = 24oC, Wet bulb temperature = 24oC i.e. relative humidity = 100%. Researches over the globe are continuing to express the heat stress and comfort zone from weather parameters [7]-[15]. Meteorologists, Agronomists, Physiologists and Biologists have proposed more than 40 heat stress indices starting from 1905 to 2005 that will give us zone of comfort within and outside the built area in relation to environmental heat stress [4], [16]. There is a need to apply these indices on regional basis. Hence for the present analysis widely used three indices are estimated to give the seasonal pattern of heat stress and also to develop regional based scales of WBGT and RSI to quantify the degree of comfortability over Kalyani in the district Nadia of West Bengal. |
II. METHODOLOGY |
| Study Area Our study area Kalyani (22.58 o N, 88.26oE) is situated in the Nadia district of West Bengal and only 60km away from Tropic of Cancer. The area has sub tropical humid climate. The daily temperature over the year ranges from 11.9oC (minimum) to 36.9o C (maximum). Rainy season lasts from June to October and peak in September (274 mm). Winter lasts only for two months. Here different habits are present. The area has good cover of greeneries in addition to residential zones. |
| Data Daily weather data of AICRP on Agro Meteorology, Bidhan Chandra Krishi Vishwavidyalaya, Kalyani for the period 1994 to 2012 and global radiation data of the Department of Environmental Science, University of Kalyani during 2009 to 2012 are used in our analysis. |
| Heat Stress Indices Thermohygrometric Index (THI), one of the simple indices used by India Meteorological Department [17] and was developed by Thom [18], [19]. |
| THI = 0.72 (Ta + Tw) + 40.6 …(ii) |
| where Ta and Tw are respectively the ambient air temperature and wet bulb temperature in Ãâ¹ÃÅ¡C Wet Bulb Globe Temperature (WBGT) was developed to account the heat related injuries during field training [20] |
| WBGT = 0.1 Ta + 0.7 Tw + 0.2 Tg …(iii) |
| where Tg is the globe temperature in Ãâ¹ÃÅ¡C. For indoor work Tg may be replaced by Ta. WBGT index is recommended by many international organizations and was adapted as NISOH, 1972 [21]. Relative strain index (RSI) was developed for a healthy people dressed with business suit at a place not acclimatized to direct heat in order to take into account the clothing insulation [22]. |
| RSI = (Ta - 21) / (58 - e) …(iv) |
| where e is the water vapour pressure. THI, WBGT and RSI are computed from the available daily weather data of Kalyani with some data gap during the years 1994 to 2012. There are on an average 5.79 thunderstorm days per year [23]. We have excluded these days from the analysis. During winter wind chill must be consider as outdoor parameter and most commonly used cold index [24] |
| W = 13.12 + 0.6215 x T – 11.37 x K0.16 + 0.3965 x T x K0.16 Ãâ¹ÃÅ¡C ...(v) |
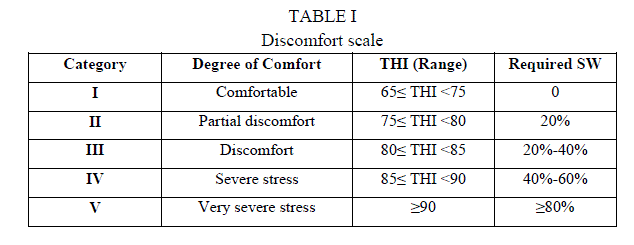
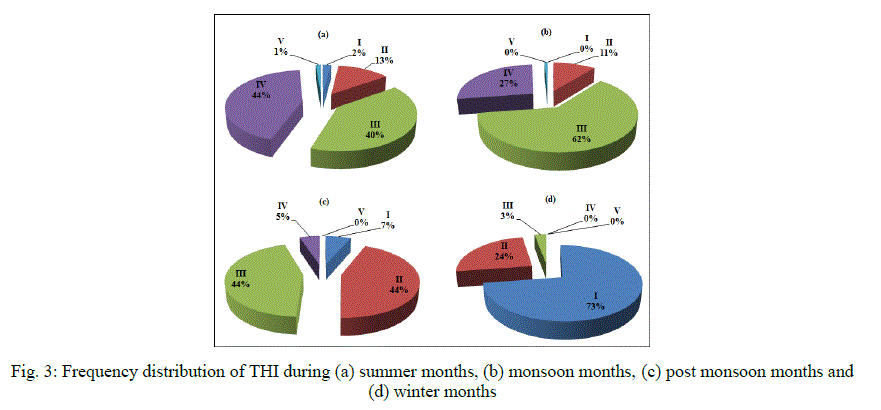
| Based on a good number of observations or surveys on a population under different climatic conditions and thermal sensations a five graded discomfort scale was developed [4], [25], [26]. THI values between 65 to 75, no heat stress is encountered by most of the population (>90%). Between 75 to 80, mild sensation of heat is felt but between 80 to 85 heat loads is moderate. Above 85 people engaged in physical work are at increases risk [27]. Table I illustrates five graded scale with required skin wettedness. |
 |
III. DATA ANALYSIS AND DISCUSSION |
| The variation of air temperature and global radiation over Kalyani follows the same pattern as shown Fig. 1. For outdoor exposure, shading is also an important factor that may affect thermal environment [28], [29]. It was reported |
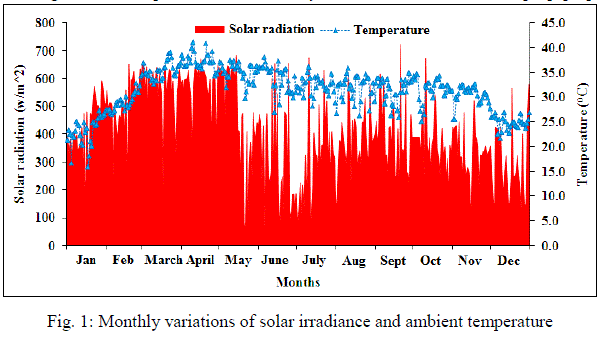 |
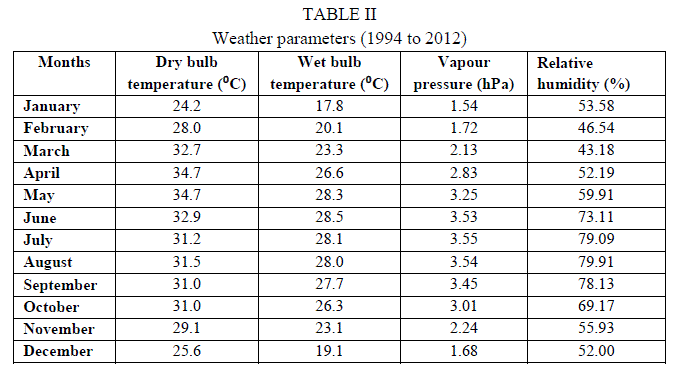
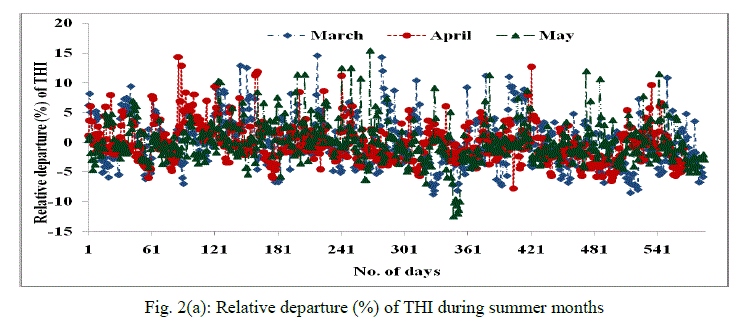
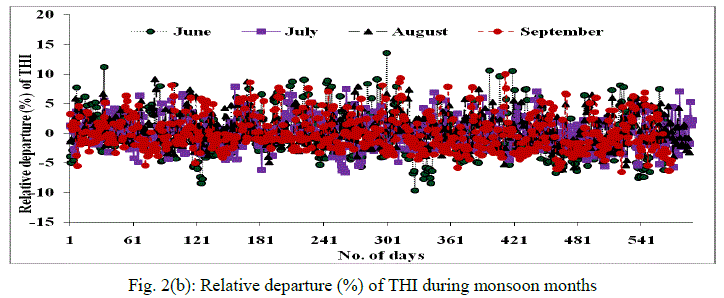
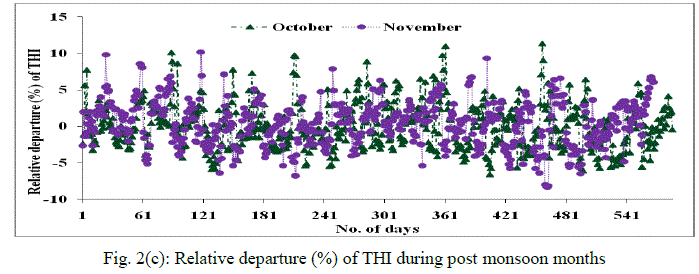
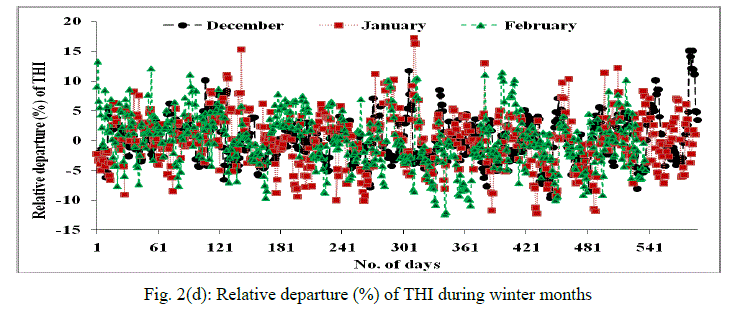
| that strong sunlight can change the effective temperature by 3.6Ãâ¹ÃÅ¡C whereas low wind can reduce the temperature by 1.9Ãâ¹ÃÅ¡C. Heat indices THI, WBGT and RSI are computed from the daily weather data at 12:00 hrs, IST. Average values of THI for the months January, February, March, April, May, June, July, September, October, November and December are found to be 70.81âÃÂðC, 75.21âÃÂðC, 80.92, 84.62, 85.88, 84.61âÃÂðC, 83.31âÃÂðC, 83.43âÃÂðC, 82.86âÃÂðC, 81.83âÃÂðC, 78.14âÃÂðC and 72.74âÃÂðC respectively. Average monthly weather parameters viz. ambient temperature, wet bulb temperature, vapour pressure and relative humidity during the analysis period over Kalyani are given in Table II. The temperature is found lowest in January and maximum in April-May over Kalyani. Temperature remains almost same during monsoon and post monsoon months. Fig. 2(a) to 2(d) represents the relative departure of THI from their respective normal values. It is observed that days having positive relative departure from normal values during summer (March –May), monsoon (June-September), postmonsoon (October-November) and winter (December-February) seasons are 42.51%, 45.97%, 50.47% and 49.44% respectively. The frequency distribution of comfortability scale is depicted in Fig. 3. It has been noted that 44.73% days fall in severe stress categories in summer whereas 27.35% and 5.03% sever stressful days fall in monsoon and post monsoon season respectively. It is interesting to note that 3.83% days of winter are fall in discomfort zone. This may be due to the fact that winter at Kalyani actually persists from mid of December to first week of February. 85.62% days of the year lies within ±5% relative departure from their respective normal values. |
 |
 |
 |
 |
 |
 |
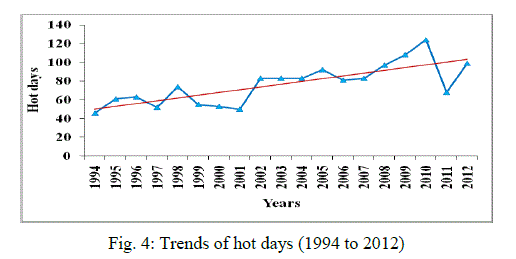
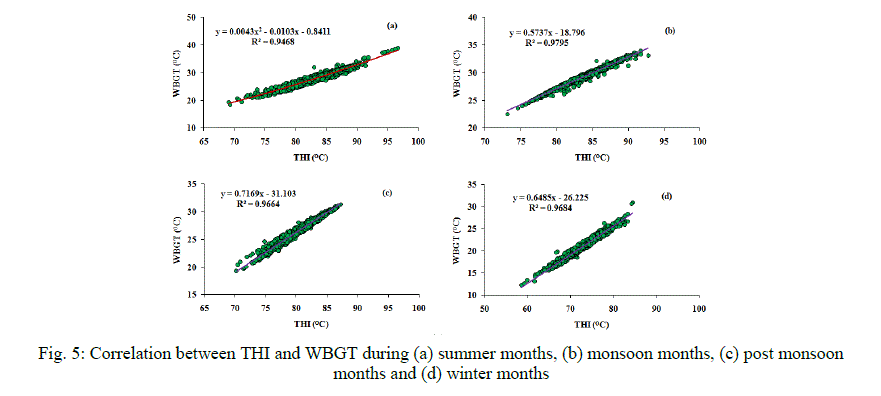
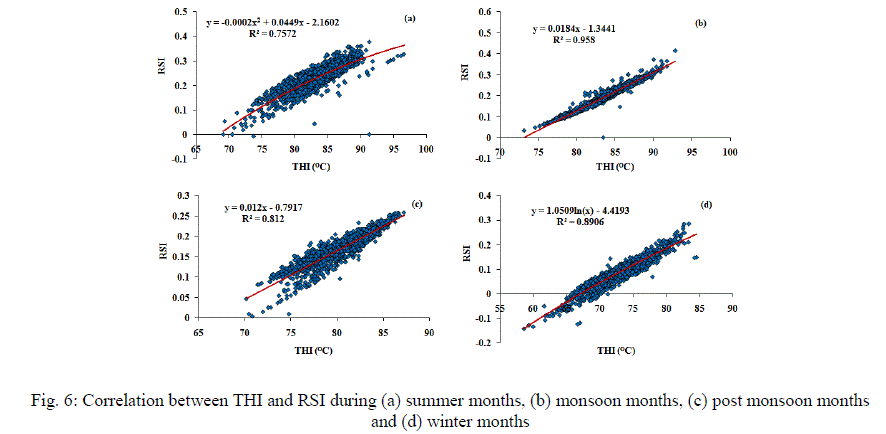
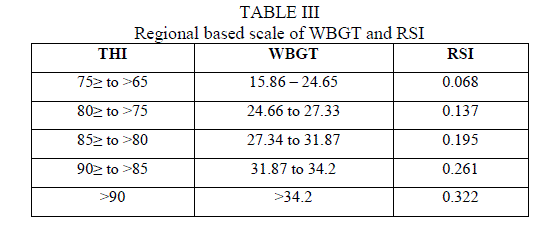
| Though the discomfort starts from 24âÃÂðC having relative humidity 100%, but days are practically hot when the ambient temperature is ≥34âÃÂðC. It is observed that hot conditions dominate for nearly 76.57 days per year. Highest hot days (category IV and V) is found in the year 2010 and lowest in 1994. An increasing trend of hot days per year is observed (Fig. 4). WBGT and RSI are still the index adopted for a board range of environment. THI are highly correlated with WBGT and RSI (Fig. 5 and Fig. 6) with R2 values ranges from 0.94 to 0.97 and 0.75 to 0.95 respectively. Since THI is the discomfort index that is in use over than five decades, we developed a regional based scale for WBGT and RSI with reference to THI as given in Table III. |
 |
 |
 |
 |
IV. CONCLUSIONS |
| There are many indices used by agronomists, agriculturists, meteorologist, physiologist and engineers that represent accurately heat stress and the comfortability zones. But for suggesting safety work rate, clothing and behavioral adjustment of a person should include in the index. Integrated approach may give better results. Other environmental parameters such as sweat evaporation, metabolic rate, wind speed, clothing insulation, relative humidity, solar radiation has both positive and negative feedback on the heat load. Based on WBGT index, ACGIH (American Conference of Government Industrial Hygienists) published permissible heat exposure threshold limits values. In addition work-rest cycle and fluid replacement volumes will sustain the performance of the worker (Table IV). However fluid need may vary on individual and exposure to open sky or shaded area. Prevailing heat load is highly needed for biometeorological perspective. |
ACKNOWLEDGEMENTS |
| Financial support of University Grants Commission, New Delhi and PURSE Programme of Kalyani University, West Bengal are thankfully acknowledged. |
References |
|