ISSN ONLINE(2319-8753)PRINT(2347-6710)
ISSN ONLINE(2319-8753)PRINT(2347-6710)
Shivashankar P 1, Venkataramana. G.V 2
|
| Related article at Pubmed, Scholar Google |
Visit for more related articles at International Journal of Innovative Research in Science, Engineering and Technology
Seasonal variation of physico-chemical parameters were studied at five different stations at Shimoga region, south of India. Surface water samples were taken and collected from river in and around of Bhadravathi town, Shimoga and analysed for temperature (ºC), pH, conductance, TS, TDS, TSS, turbidity, hardness, total alkalinity, D.O., NO3-, Cl -, Ca +2 and Mg +2,. One of the sites (SP3) found to be moderately polluted due to over anthropogenic disturbance. The results were considered for correlation analysis and it was observed that many of the parameters bear a good positive correlation and some are showed negative correlation among the sampling points of the study area.
Keywords |
| Bhadra river, physico-chemical parameters, Seasonal fluctuation, DO, freshwater. |
INTRODUCTION |
| Water is one of the major primary driving forces for physical, chemical and biological changes throughout the world (Boyd, 2000). Water plays a key role in ecosystem. Due to increased human activity, water pollution is widely spreading throughout the world. Begum and Harikrishna,(2008) studied the quality of water in some streams of Cauvery river at Mandya district, Karnataka, India and observed some significant variation in physico-chemical parameters at different stations. Freshwater is a limited resource, which is very essential for all living organisms and also for different uses of mankind, agriculture, industry and domestic purposes (Bartram and Balance, 1996). The healthy condition of the aquatic system depends upon its physical, chemical and biological characteristics which actually fluctuate with season and degree of pollution (Cairns and Dickson, 1971). The quality of water is vastly deteriorated due to unscientific waste disposal and improper waste management. Increased anthropogenic activities in and around water bodies damage the quality of aquatic systems and ultimately the physico-chemical properties of water (Mona and Mandhanya, 2012). |
| The review of literature showed that the knowledge on the ecology of the Bhadra river, Shimoga district and the scope for better utilization of the water resource. With this consideration, in the present study more importance was given for assessing the physico-chemical properties and its present status in these areas, which provide baseline information for the status of water for further usage of mankind. |
II. MATERIALS AND METHODS |
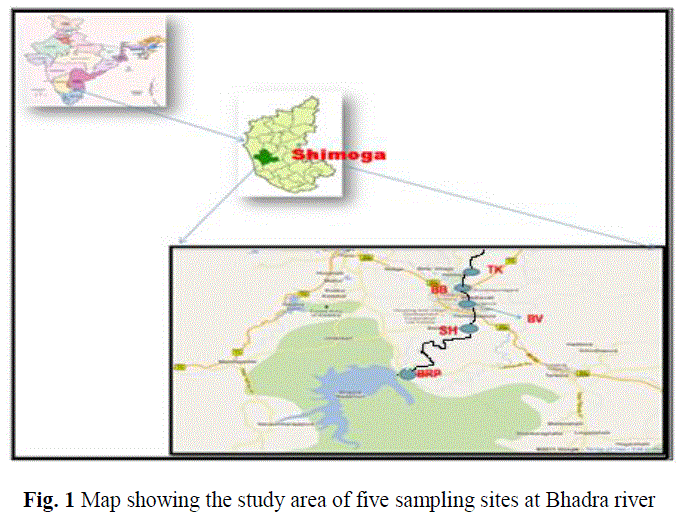
| Description of the study site: A preliminary survey of the Bhadra River was done using the Toposheet 48 O/9 and 48 O/10. The study has been conducted in the downstream of Bhadra River, which flows 186 km from the origin and meets with Tunga River. The survey covered five villages on both right and left banks of the river, namely: BRP (Bhadra Reservoir Project), 13o 42'.00'' N latitude and 75o 38'.20'' E longitude, Sunnadahalli 13o 82'.17'' N, and 75o 71'.51'' E Bhadravathi 13° 52' N and 75° 40' E, Baballi 13°57'18.99"N and 75°42'53.62"E and Thallikatte 13° 53' 59.99"N and 75° 43' 2.88" E(fig 1). The river water is found to be moderately polluted in and around Bhadravathi area due to discharge of effluents from industries, in addition to that indiscriminate use of river water for various domestic activities like, washing clothes, utensils, cattle and heavy vehicles, etc. slaughter house waste is also dumping into the Bhadra river at Bhadravathi. |
 |
| Sample Collection and Physico-chemical Analysis: Water samples collected in clean polythene containers every month from March 2011 to April 2012, during the early hours between 7.00 to 9.00 am.: Temperature is recorded on the spot using Centigrade thermometer. Physico-chemical parameters like pH (pH meter), conductivity (Conductivity meter), TDS (gravimetric method), total hardness, Ca hardness, Mg hardness (titrimetric method), total alkalinity (phenolphthalein and methyl orange alkalinity), Dissolved Oxygen (Winkler’s method), Chloride, (Silver nitrate (AgNO3) method), phosphate (spectrophotometer, Venedomolybdate method) and Nitrate (Brucine-sulphate method) was estimated using standard methods APHA (2005). |
III. RESULTS OF THE PHYSICO-CHEMICAL PARAMETERS |
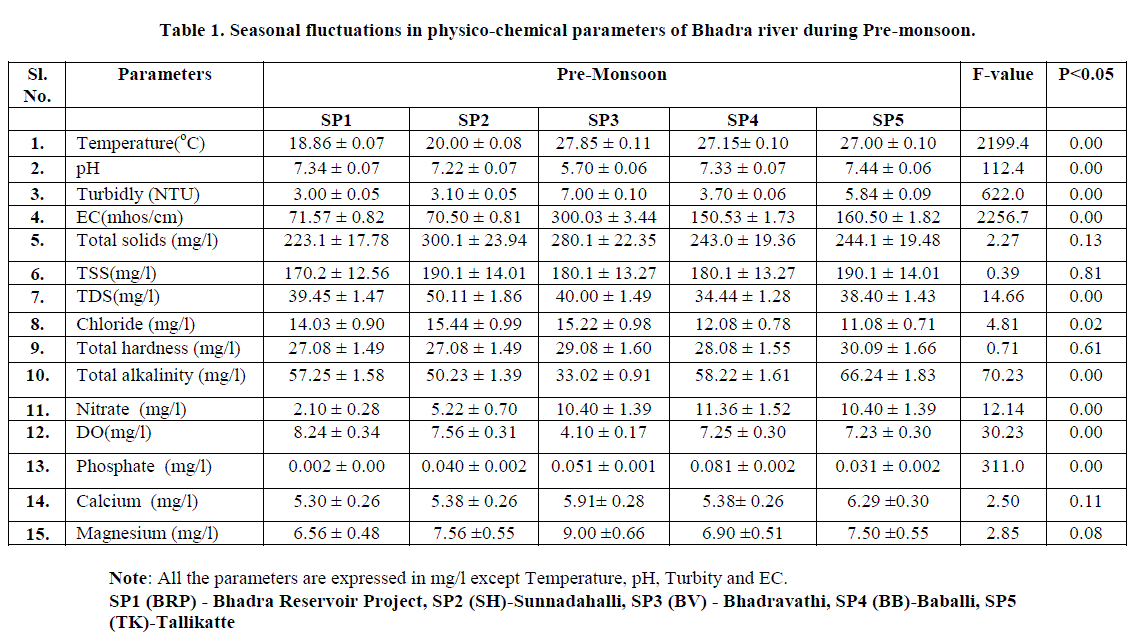
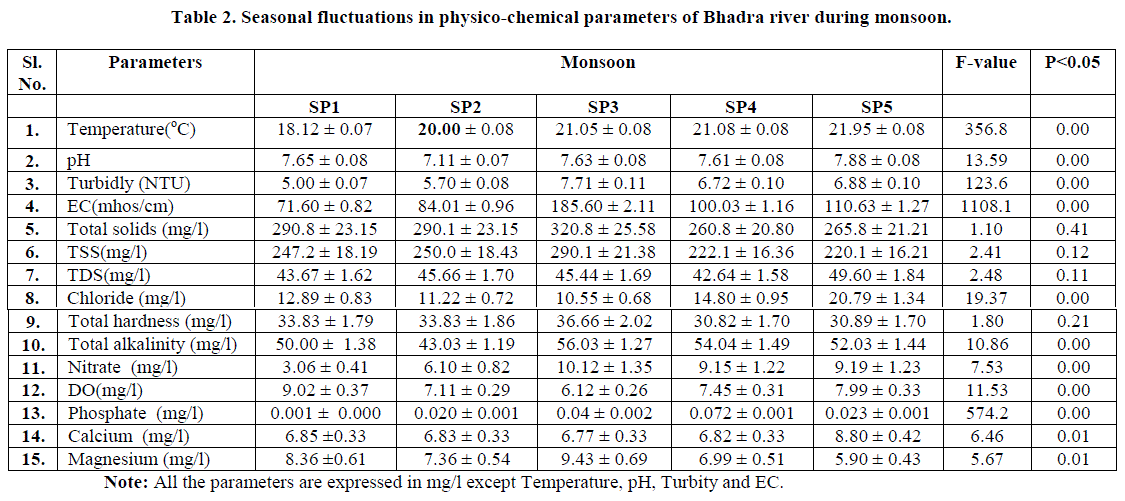
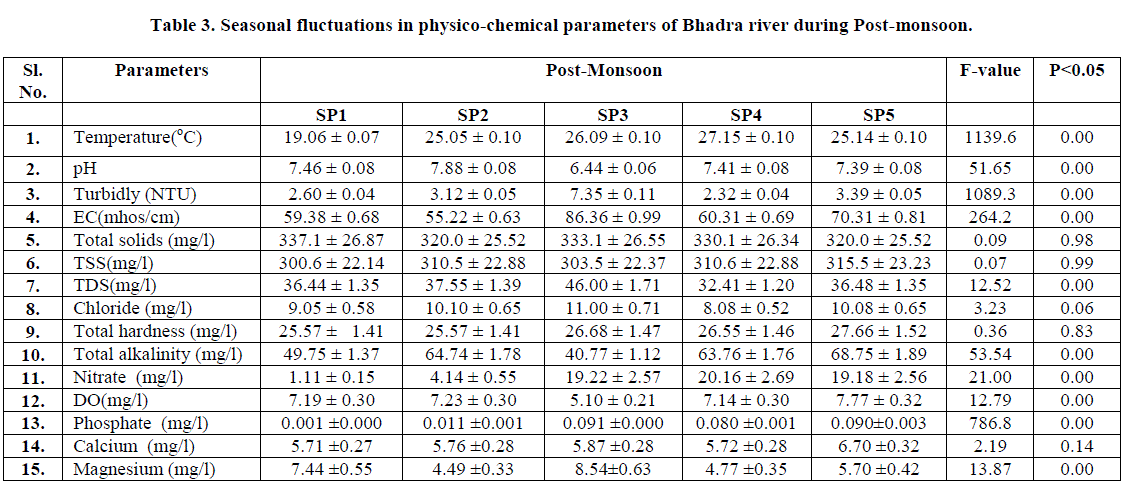
| Physico-chemical parameters of water in the rivers enable us to understand the suitability of the water for the aquatic life, functioning of the ecosystem and its utility for human welfare. Assessment and analysis of the significant abiotic factors are important for better ecological understanding of the water bodies. It is a well established fact that the aquatic life is influenced or governed by the physicochemical status of water bodies, which intern determines the functioning, health and homeostasis of the ecosystem. The physico-chemical characteristics of the waters are also instrumental in establishing the diversity of aquatic species. In this context, an attempt has been made in the present investigation to know the water quality of Bhadra ecosystem. The results of the Physico-chemical analysis of the five sampling sites of Bhadra river during different seasons are presented in Table 1 to 3. The results obtained have been subjected to SPSS – ANOVA. The results of various physicochemical parameters are detailed as below. |
IV. DISCUSSIONS |
| Water temperature is an important parameter because it influences the biota in water body by affecting activities such as behavior, reproduction and metabolism. It is necessary to study temperature variation in water body, because water density and oxygen content are temperature related and hence temperature indirectly affects osmoregulation and respiration of the animal (De, 2002). The maximum temperature was recorded during pre-monsoon (27.82 ± 0.11°C) at SP3 (Table 1) and the minimum was recorded in monsoon (18.12 ± 0.07) at SP1. The fluctuations of the water temperature in different seasons are due to atmospheric conditions, location, time of collection and some other environmental effects. |
 |
| Natural water usually has pH between 6.0 and 8.5. Changes in pH together with conductivity of a water body can indicate the presence of certain pollutant (Dwivedi and Santoshi, 2004). The seasonal variations of pH did not show any significant variation in the sampling sites except Bhadravathi site. Such type of variation in pH value has been reported by Deviprasad et al., (2009): Smitha et al., (2013), in wetlands of Mysore. Maximum turbidity value was recorded at BV site (7.71 ± 0.11 NTU) during monsoon; while the least was observed at BB site (2.32 ± 0.04 NTU) in post-monsoon season (Table. 3). High values of turbidity in monsoon may be due to influx of rain water in the catchment area, cloudiness, less penetration of light, washes, silt, sand and high organic matter and low transparency due to suspended inert particulate matter. Similar results have been reported by Narayana et al., (2008). |
 |
| SP1 (BRP) - Bhadra Reservoir Project, SP2 (SH)-Sunnadahalli, SP3 (BV) - Bhadravathi, SP4 (BB)-Baballi, SP5 (TK)-Tallikatte |
| Generally electrical conductivity of a river is lowest at the source of its catchments and as it flows along the course of the river, it leaches ions from the soils and also picks up organic materials from biota and its detritus (Ferrar, 1989). The values of electrical conductivity were found to be comparatively higher during pre monsoon (300 ± 3.44μmhos/cm) at SP3 and the values are well below during post monsoon in all the sites (Table 3). Higher conductivity value during pre-monsoon may be due to increased rate of evaporation leading to high concentration of salts. The maximum value of total solids was recorded (337± 26.87 mg/l) at SP1 during post monsoon. Minimum value of TSS was recorded (170.2 ± 12.56 mg/l), total suspended solids showed significant positive relation with, pH, turbidity and TS. High values of total solids during monsoon and post monsoon is may be due to siltation, deterioration, heavy precipitation and mixing runoff which carries mud, sand, etc., mixed in the river water. Similar such results have been reported by Salve and Hiware (2006). |
| The chloride concentration is higher in organic waste and its higher level in natural water is definite indication of pollution from domestic and industrial waste water (NEERI, 1979). The increase in chloride concentration in rivers and dams is due to the discharge of industrial and municipal wastes reported by Chandrasekhar et al., (2003). In the present study total hardness showed significant positive relationship with turbidity, EC, TDS and pH. It showed negative relationship with water temperature. The maximum value was recorded (36.66 ± 2.02 mg/l) at SP3 during monsoon and minimum value was recorded (25.57 ± 1.41mg/l) during post monsoon at SP2 (Table 3). In the present investigation the maximum hardness recorded during monsoon may be due to leaching of rocks in catchment area, similar results have been reported by Pawar and Pulley, (2005) studied on pethwadaj dam, Nanded, Maharashtra. |
 |
| Alkalinity is a measure of, amount of strong acid needed to lower the pH of a sample to 8.3 which gives free alkalinity (phenolphthalein alkalinity) and to a pH 4.5 gives a total alkalinity. Total alkalinity is a measure of capacity of water to neutralize strong acid. It showed negative relationship with temperature, EC, TS and TDS. The maximum value was recorded (68.75 ±1.89 mg/l) at SP5 during monsoon (Table 2); minimum value was recorded (33.02 ± 0.91mg/l) at SP3 during pre monsoon. Nitrate is an essential nutrient but also a good indicator of contamination from natural and human activities. In the present study nitrate ranged from 1.11 ± 0.15 mg/l to 20.16 ± 2.69 mg/l. Nitrate levels in river water often show marked seasonal fluctuations with higher concentration being found during pre monsoon to post monsoon. This could be due to domestic sewage, washing activities and industrial effluents. Similar results have been reported by Smitha et al., (2007). |
| In the present investigation DO concentration in the river exerted a seasonal change which is accordance with investigations of Huddar, (1995). DO showed positive relation with pH and alkalinity. It showed negative relationship with temperature, EC and turbidity. During monsoon higher oxygen concentration of 9.02 ± 0.37 recorded at SP1 (Table 2). Higher level of DO in monsoon indicated higher autotrophic activity and low organic and inorganic load. This is in accordance with the reports of Hujare (2005). Low values of oxygen recorded (4.10 ± 0.17 mg/l at SP3 during pre-monsoon. The variations of calcium may be due to addition of sewage and surface runoff from the catchment areas; the decrease may be due to calcium being absorbed by living organisms. The maximum values of magnesium were recorded during monsoon (9.43 ± 0.69 mg/l) at SP3 and minimum (4.49 ± 0.33 mg/l) at SP2 during post monsoon. High level of magnesium may be due to the addition of sewage waste and pollutant disposal into river water. Similar such observations were noticed by Mona and Mandaniya, (2012) in central region, Panipat, India. |
V. CONCLUSION |
| The result obtained during study was analyzed and it was found that maximum number of parameters were below the desirable limit.One of the sites (BV) is moderately polluted due to high amount of organic load and direct discharge of municipal waste to the river. |
ACKNOWLEDGEMENTS |
| Authors are thankful to DOS in Environmental Science, Manasagangotri, University of Mysore, Mysore, for providing the necessary facilities to carry out the present work. |
References |
|