ISSN ONLINE(2319-8753)PRINT(2347-6710)
ISSN ONLINE(2319-8753)PRINT(2347-6710)
Arun Kumar Mishra1 , Prabhat Srivastava2, R. S. Patil3
|
| Related article at Pubmed, Scholar Google |
Visit for more related articles at International Journal of Innovative Research in Science, Engineering and Technology
In this paper an attempt has been made to study the variation of PM10 at different receptor locations around an upcoming airport at Navi Mumbai, India. Air monitoring was carried out during all seasons in the base year i.e premonsoon, monsoon, post monsoon and winter season and results were analyzed. It was observed that overall yearly average concentrations of PM10 are lower than permissible lower limit of CPCB except two stations. It was found that PM10 concentrations were highest during winter season and PM10 is decreasing during pre monsoon, monsoon and monsoon seasons. Aviation affects the environment through the emission of pollutants from the aircrafts and other supporting airport infrastructure facilities, resulting on human health and the atmosphere. Emitted pollutants resulting from the aircrafts include green house gases and particulates matter that contribute to forcing of climate and gases and particulate matter that are harmful to human health. Navi Mumbai in the state of Maharashtra, India has been chosen as the study area. The PM10 concentrations were compared with the National Ambient Air Quality Standards (NAAQS).
Keywords |
| Airport, PM10 , secondary particles,NAAQS |
I INTRODUCTION |
| Particulate matter is the term for particles and liquid droplets suspended in the air. Particles emitted directly into the air are called primary or direct PM.Other particles are forms indirectly in the atmosphere from the gaseous reaction of the pollutants known as precursors. Sources of direct PM and PM precursors include factories, power plants, vehicular traffic, airports, construction activity and natural sources such as fires and windblown dust.PM0 refers to the particles having diameter 10 micrometer or less.Urban air pollution due to vehicular emission is a matter of great concern because of exposure of large number of people to it.Vehicular emission is responsible for higher level of air pollutants like SPM, RSPM, SO2 and other organic, inorganic pollutants including trace metals and their adverse effects on human and environmental health (Caselles et al, 2002, Curtis et al. , 2006; ,Jayaraman, 2007). Vehicular exhaust is one of the most important source of fine particles (Nolte et al. , fang et al.,2005; Barman et al., 2008). Various types of vehicles and their different operating modes such as stop and start, idling, accelerating and decelerating combined with a high density of vehicles leads to a pollution source problem (Kumar et al., 2001). The respirable particles are responsible for cardiovascular as well as respiratory diseases (Segal et al., 1996) of human beings because these particles can penetrate deep into respiratory system and various studies concluded that smaller the particles, more severe the health impacts (Schwartz et al., 1996). |
II DESCRIPTION OF THE STUDY AREA |
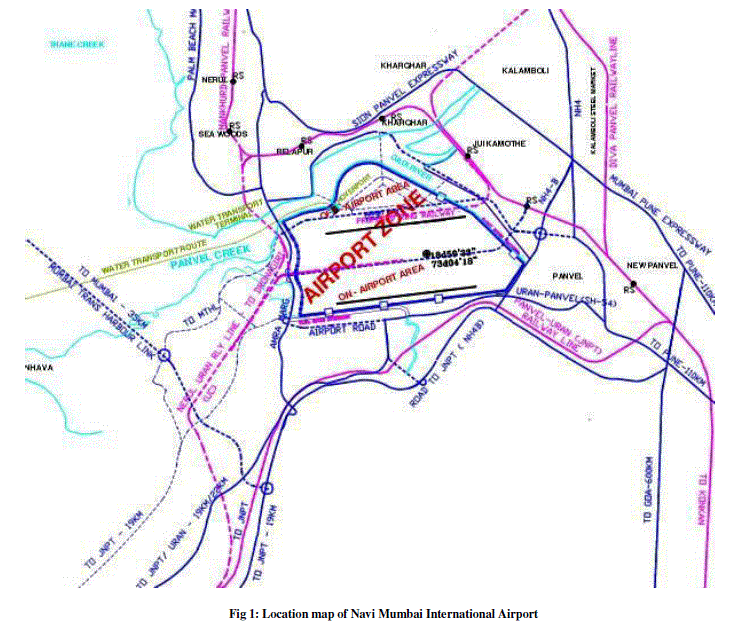
| The site of Navi Mumbai airport is selected near Panvel town in an area admeasuring 2347 acres of land which is situated about 45 km away from the CBD of Mumbai/Santacruz airport. The airport is planned with two runways of 3700 M with parallel taxiways designed to suit the new generation large aircraft. The other facilities include the domestic terminal, international terminal, cargo terminal, airfield lighting, city side facilities etc. The phase wise development approach has been adopted to suit the air travel demand The study area shown in Figure 1 covers the area around the airport falling within the radius of 10 kms. The study area is further divided in two parts namely core area and fringe area. The core area covers the area within the radius of 10 km, in which all the scooped environmental parameters have been studied to understand the magnitude of impact. In the remaining area i.e. fringe area places of historical importance, aesthetics, cultural including environmentally sensitive have been studied |
 |
III SAMPLING AND ANALYSIS |
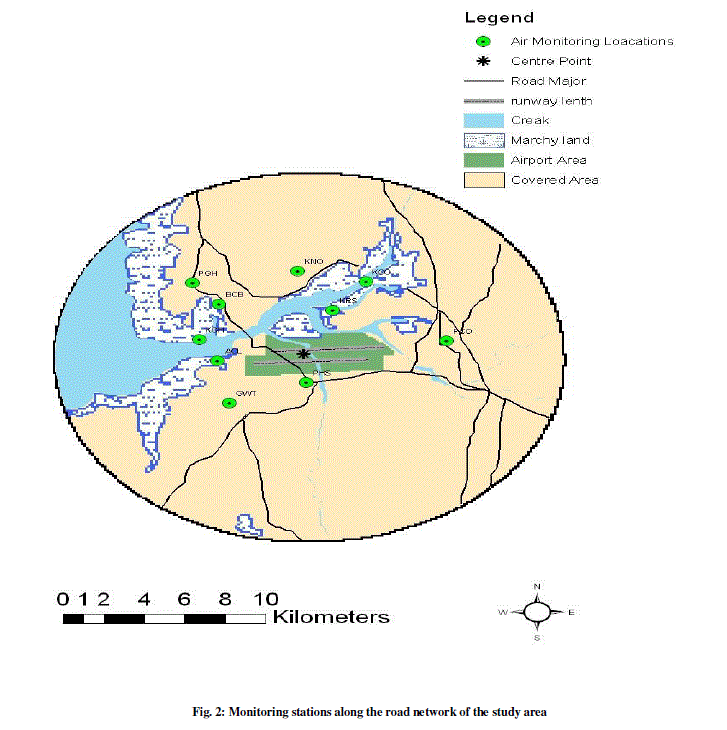
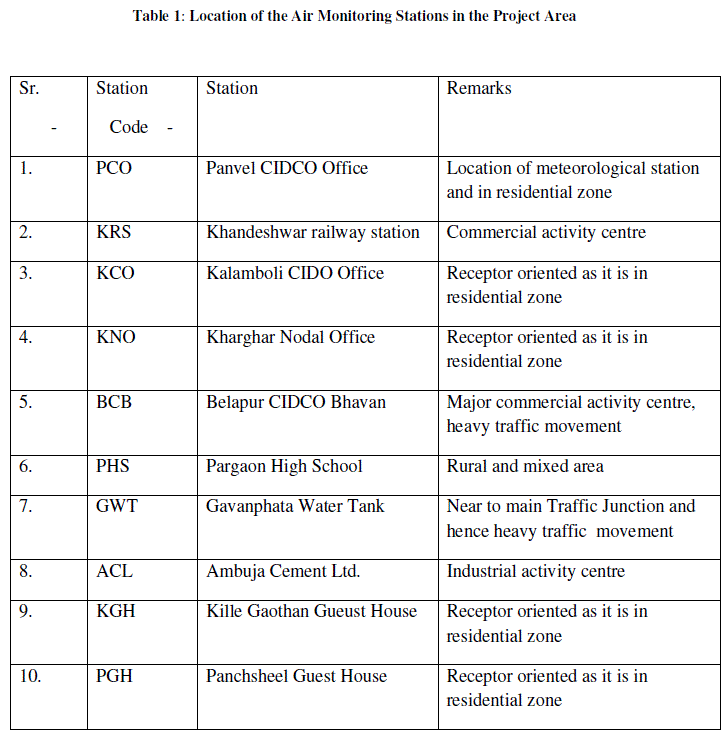
| Air quality assessment of the project area was carried out by monitoring the pollutants at different receptor locations (Fig.2). The pollutants which were monitored are;, Total Suspended Particulate Matter (TSPM), Respirable Particulate Matter (RSPM or PM10), Oxides of Nitrogen (NOx), Sulphur dioxide (SO2), Carbon Monoxide (CO), and Hydrocarbons (HC). The selections of stations were based on WHO (1981) guidelines. The monitoring was done during all seasons of the base year i.e premonsoon, monsoon, post- monsoon and winter season at a frequency of twice a week at each station for 24 hours. Respirable Dust Sampler and High Volume Sampler were used for monitoring of RPM, TSPM and gaseous pollutants like SO2 and NOx. To monitor the traffic pollutant Carbon Monoxide, a portable multi gas monitor with digital display was used. CO pollutant was monitor at all the 10 locations at a frequency of twice a week at each station for 24 hrs. Anemometer was used to note the wind speed and direction. Digital thermometer was used to record the existing temperature. Horizontal and vertical dispersion parameters were taken based on the atmospheric stability class B and downwind distance. |
 |
 |
 |
IV RESULTS AND DISCUSSION |
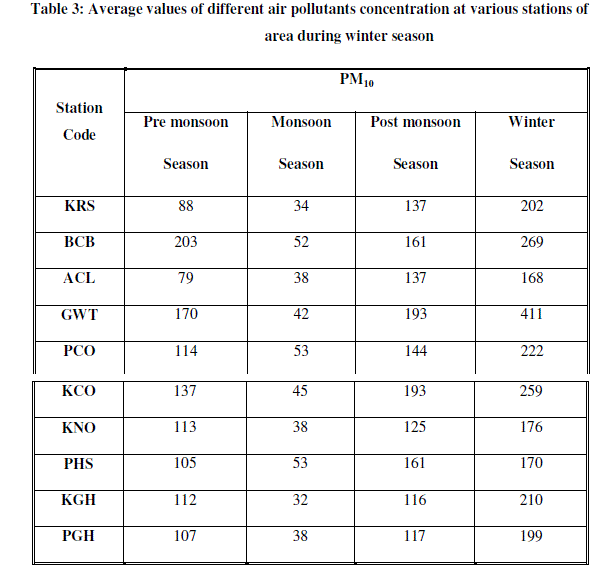
| In this study the mass concentration of PM10 and its associated chemicals constituents analyzed. Results obtained from the analysis were compared from the standards prescribed by CPCB and these results are given in following table 3 |
 |
V CONCLUSION |
| The average concentrations of PM10, in the study area during post monsoon season were in the range of 116-193 μg/ m3 , |
| The average concentrations of, PM10, in the study area during winter season were in the range of 170-411 μg/ m3 |
| The average concentrations of PM10, in the study area during pre monsoon season were in the range of 79-203 μg/ m3 , |
| The average concentrations of PM10, in the study area during monsoon season were in the range of, 32-53 μg/ m3 |
| The average concentrations of PM10, NOx, SO2, NH3, CO and HC in the study area during winter season were in the range of, 170-411 μg/ m3 , 20.4-32.0 μg/ m3 ,3.4-4.7 μg/ m3 , 27.0-37.6 μg/ m3 , 0.6-0.8 μg/ m3 , 2.01-2.30 μg/ m3 respectively. |
| Air monitoring results of the study period showed that PM10 were highest during winter season whereas concentration of PM10 was observed to be decreased during pre monsoon, monsoon and post monsoon season. Winter season is the worst time for air quality, since surface atmospheric temperature drops down with an inversion condition. Little mixing or dilution of pollutants takes place at this stability condition (low mixing height) of the atmosphere and hindered pollutant dispersion during winter months. Moreover, suspended particles in the study area are natural and not chemical in nature and may not have adverse effect on human health. |
VI ACKNOWLEDGEMENT |
| The authors are thankful to Dr Omkar Dixit and Dr. Mukesh Sharma, Professors, Civil Engineering Department, I.I.T. Kanpur-208016 (U.P.), India for their valuable guidance and suggestions. |
References |
|