ISSN ONLINE(2278-8875) PRINT (2320-3765)
ISSN ONLINE(2278-8875) PRINT (2320-3765)
Aarti Gupta1, Pankaj Chawla2, Sparsh Chawla3
|
| Related article at Pubmed, Scholar Google |
Visit for more related articles at International Journal of Advanced Research in Electrical, Electronics and Instrumentation Engineering
Price forecasts are crucial information for the power producers and consumers when planning the bidding strategies in order to have maximum benefits. The choice of forecasting model becomes an important tool how to improve the price forecasting accuracy. In this paper a combination methodology of ANN and fuzzy Inference System (FIS) is used to forecast the short term electricity prices. The Indian electricity market data was used to test the system. These methods are examined on the Indian Electricity Market in year 2012 Comparison of the forecasting performance with ANN and FIS-ANN method is presented. The results indicate that FIS-ANN method improves the price forecasting accuracy. The developed system show considerable improvement in the performance regarding price data, achieving MAPE is less than 3% with FIS-ANN as compared with ANN.
Keywords |
| Artificial neural network (ANN); Electricity Price forecasting; Indian Electricity Market; Fuzzy Logic |
INTRODUCTION |
| With deregulation in many electricity markets around the world, knowledge of possible future values of demand and the corresponding price has become more significant to the different entities on the market – generators and electricity traders for determining bidding strategies, and system operators for administration of the market [1]. |
| Generally commodity prices are compelled by supply and demand balance. In electricity market the traded „commodityâÃâ¬ÃŸ cannot be stockpiled economically, the constraints are defined by the system total capacity to satisfy demand at any given time [2]. This therefore causes electricity prices to have a high probability of volatility, which masks observable trends necessary for forecasting future values, especially in the short term. |
| Short-term forecasts cover the period of f ew d a y s a h e a d . These are useful for dispatch and short-term or spot trading. Short term trading is meant to service the short-term variations in load and the actual prices are only known after matching of bids and offers by the market operator [1]. This presents a challenge in that to place effective bids; the traders need to have an idea of the future values of the demand and its corresponding price. |
| Different models have been employed in power systems for achieving forecasting accuracy and these include: regression, statistical and state space methods [3,5]. Artificial intelligence based approaches have been explored based on expert systems, evolutionary programming, fuzzy systems, artificial neural networks and various combinations of these. One of the most widely used methods is the auto regressive integrated moving average model (ARIMA). The popularity of this model is due its statistical properties as well as well known Box- Jenkins methodology in the model building process. The main challenge with this has been to make accurate non-linear mathematical models. Also, complete system data is not always readily available and the great computational effort required. |
| Besides these methods artificial intelligent methods have been used in this field recently. Artificial neural networks (ANNs) have been applied in many researches for forecasting electricity price [6]. the most important advantages of this method is its flexibility in using nonlinear models, using ANN there is no need to introduce a particular model form. And they adaptively formed based on the features presented from the data. This feature is suitable for many empirical datasets where there is no specific theoretical guidance presented. Other methods such as fuzzy neural network methods [7], support vector machines (SVMs) [8] in this field. |
| In actual electricity markets, price curve exhibits considerably richer structure than load curve and has the following characteristics: high frequency, non-constant mean and variance, multiple seasonality, calendar effect, high level of volatility and high percentage of unusual price movements. All these characteristics can be attributed to the following reasons, which distinguish electricity from other commodities: |
| (i) Non-storable nature of electrical energy |
| (ii) Requirement of maintaining constant balance between demand and supply |
| (iii) Inelastic nature of demand over short time period |
| (iv) Oligopolistic generation side |
| In addition to these market equilibrium is also influenced by both load and generation side uncertainties [4]. |
| To estimate future values of any parameter o n e needs to have some information on factors that influence that parameter, or trends that describe the parameter of interest. A number of parameters have been analysed to determine their usefulness as inputs data for short term estimation. These include past demand and price data [2]. |
| Presented in this paper is an approach to utilizing artificial neural networks (ANN) to extract trends from past data of the same parameters and use that to predict possible future values. The price forecasting is done based on different methods including artificial neural network and fuzzy logic. The results of different methods are compared is examined by using data Indian electricity market. |
| In the wholesale electricity markets different types of prices exist, but the most basic pricing concept is the market clearing price (MCP). When there is transmission congestion in the system then other prices concepts such as the location marginal price (LMP) and the zonal market clearing price (ZMCP) are used. This paper focuses on MCP which is not dependent on internal transmission constraints. |
METHODOLOGY |
| There are several time series forecasting models including the moving average linear regression and GARCH techniques. In spot markets the MCP can be considered as a non-stationery stochastic time series with equal time intervals. More recently the new techniques like ANN, Game theory, Fuzzy and chaotic models have been suggested. |
A. Artificial Neural Networks |
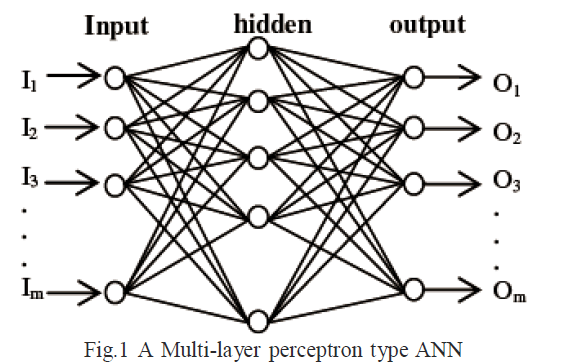
| An artificial neural network (ANN) is a model that emulates the functional architecture of the human brain. In this research a multi-layer perceptron ANN is adopted. This ANN consists of: an input layer, hidden layers and an output layer as shown in Fig. 1. Except for the in-put layer, each neuron receives a signal that is a linearly weighted sum of the outputs from all the neurons in the preceding layer. |
| Activation of neuron j is then defined as |
 |
| Where, if neuron j is a hidden neuron, |
 |
| Otherwise, fj(x) = x, i covers all the neurons in the in the layer (k-1). Note, the activation of the jth neuron in the kth layer, Uj (k) in (1), is only a function of the activations of the neurons in the (k-1)th layer and the weights which connect the jth neuron in the kth layer with the neurons in the (k-1)th layer. The non-linearity fj(x) can be any monotonic function differentiable in the x domain. |
B. Fuzzy Inference Systems |
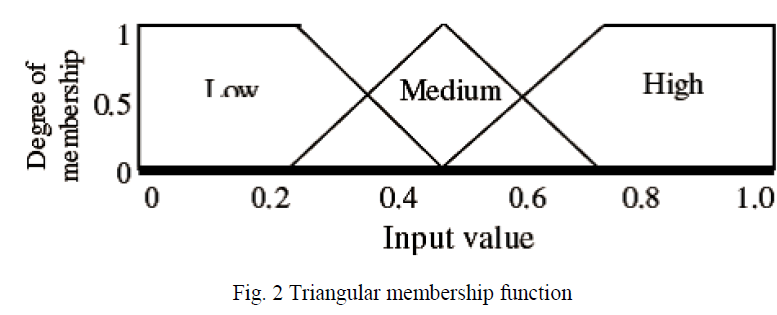
| Fuzzy inference is an implementation of fuzzy logic in which linguistic like rules map the input onto output space without strict specification of the input [3, 4]. Fuzzy Logic: if X is a universe of discourse with elements denoted by x, then the fuzzy set A in X is defined as a set of ordered pairs, A = {x, μA(x)|x ε X}. μA(x) is called the membership function of x in A. Fig. 2 shows the triangular membership function used for three different fuzzy sets; Low, Medium and High. |
 |
| Fuzzy inference systems (FIS) use fuzzy rules (IF - Then) and fuzzy reasoning, an inference procedure that obtains conclusions from a set of fuzzy rules and known facts. Three conceptual components: rule base (fuzzy rules selection); database (membership functions) and reason mechanism inference procedure thus form the basic structure of a fuzzy inference system. |
C. System Configuration |
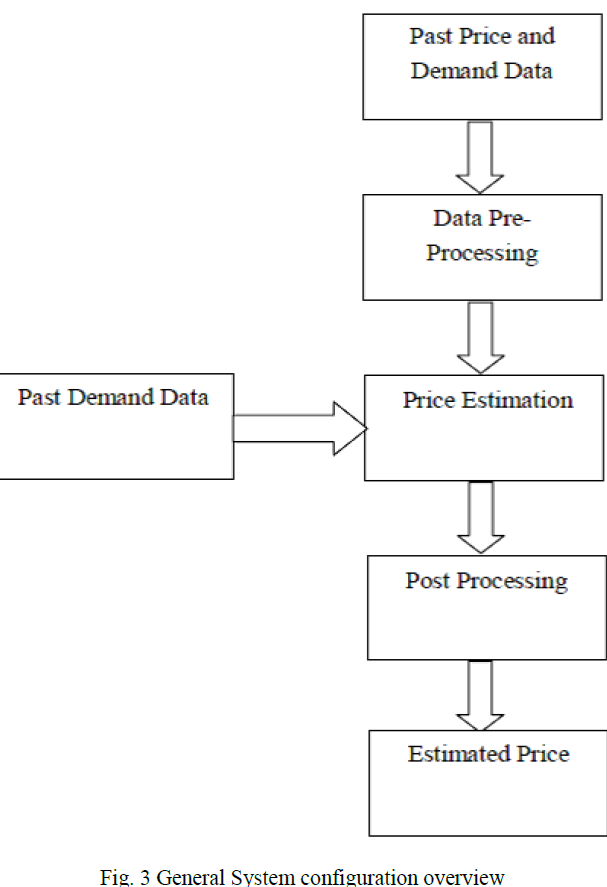
| A number of configurations based on the proposed approach were setup. A system with cascaded processing elements was setup as shown in Fig. 3 below. Included are data conditioning and classification blocks apart of preprocessing and post-processing for the price estimation path [9]. |
D. Performance Analysis |
| order to evaluate the accuracy of the forecasting the electricity prices different criterions are used, that is, the Mean Absolute Percentage Error (MAPE) which is defined as: |
 |
| Where, |
| Va = Actual price |
| Vf = Forecast price |
| N = Number of Days for forecasting |
 |
E. Data Sets |
| The combination methodology of Fuzzy and ANN is performed using the data of Indian Electricity Market (IEM) [2] in the year 2012 is considered as a real world study. The price curves are given in Fig 4.The data have been extensively studied with a vast variety of non-linear time series models including FIS-ANN and ANN. To assess the forecasting performance of different models, each data set is divided into two samples of training and testing. The training data is used extensively for the model development and then the test samples are used to evaluate the data. For the sake of fair comparison the year 2012 is selected. To build the forecasting mode quarterly for the year 2012, the information includes the Daily price historical data of the year 2012 in four clusters. |
 |
RESULTS AND DISCUSSIONS |
| After training the different network configurations (size) were tested with the data sets not used for training to measure the performance. The performance was measured for ANN and FIS-ANN models by using of MAPE values for different defined clusters. |
A. Result of ‘A’ Cluster |
 |
| Results shown in Table II above show the accuracy comparison of price estimation between ANN and FIS-ANN model at different network sizes for cluster „AâÃâ¬ÃŸ. Here the MAPE results clearly indicate that the accuracy of price forecasting with FIS-ANN model is better as compared to ANN model |
B. Result of ‘B’ Cluster |
 |
| Results shown in Table III above show the accuracy comparison of price estimation between ANN and FIS-ANN model at different network sizes for cluster „BâÃâ¬ÃŸ. Here the MAPE results clearly indicate that the accuracy of price forecasting with FIS-ANN model is better as compared to ANN model |
C. Result of ‘C’ Cluster |
 |
| Results shown in Table IV above show the accuracy comparison of price estimation between ANN and FIS-ANN model at different network sizes for cluster „CâÃâ¬ÃŸ. Here the MAPE results clearly indicate that the accuracy of price forecasting with FIS-ANN model is better as compared to ANN model |
D. Result of ‘D’ Cluster |
 |
| Results shown in Table V above show the accuracy comparison of price estimation between ANN and FIS-ANN model at different network sizes for cluster „DâÃâ¬ÃŸ. Here the MAPE results clearly indicate that the accuracy of price forecasting with FIS-ANN model is better as compared to ANN model |
| It is clear from the above tables that, the result of FIS-ANN model shows significant improvement as compares to the ANN model. |
CONCLUSIONS |
| Electricity price in the short term shows high volatility making it difficult to predict its future value, but with the proposed approach of combined model FIS-ANN significant improvement in the forecasting can be achieved. The key element in the processing is the selection of input data and careful pre-processing. Here the input factors chosen for the electricity price forecasting are the past price and demand data. |
| MAPE value is used for measuring the performance of the model; lower MAPE value shows forecasted price is close to the actual price. MAPE value is used to measure the performance of the various models used for price forecasting. The above result and discussion concludes that for all the clusters the MAPE values are less with FIS-ANN model as compared to the ANN model which means that the proposed model/approach generate reasonably good forecast results. Thus the combined approach of FIS-ANN is more efficient in predicting the electricity price. From the forecasted results found in this work it can also be concluded that the proposed model performs very well with the absence of volatility and can be used to predict the market price. The future scope in this area may include selection of more appropriate input variable including price volatility analysis. |
References |
|