ISSN ONLINE(2278-8875) PRINT (2320-3765)
ISSN ONLINE(2278-8875) PRINT (2320-3765)
| P.Banupriya PG student, Easwari Engineering College, Chennai, India |
| Related article at Pubmed, Scholar Google |
Visit for more related articles at International Journal of Advanced Research in Electrical, Electronics and Instrumentation Engineering
Correlated component failures (COCOF) may degrade the reliability of a component based software application, and hence these failures should be expressly incorporated into the software reliability analysis process. The correlated component failures on the software application reliability should be analyzed within the context of the applying design and the architecture of the application can be represented based on the CTMC. Several Contemporary reliability analysis approaches introduce an exponential number of parameters and are computationally inefficient, however, cannot scale to even small-sized software applications. This paper presents an efficient, scalable approach to analyze the reliability of component-based software applications with COCOF. As a result the approach is simple and efficient, and can be applied to large systems to determine the correlations.
Keywords |
| Architecture based analysis, Correlated component failures, Continuous time markov chain, Multivariate bernoulli distribution, Sensitivity analysis |
INTRODUCTION |
| The system reliability can depends on the individual components reliability and software development process based on the component-based software design.The modeling approaches that are capable of considering the architecture of the system reliability can be estimated by taking into account the interactions between the components,the usage of the components,reliabilities of the components and their interfaces with other components.The model based analysis characterizes application reliability based on its components and its architecture. Many analytical models have been proposed to identify the problem of the software reliability. The reliability of the program can be measured as one minus the probability of failure.If the program gives correct answer,the reliability of a program is equal to one otherwise it is zero.A failures are occur if,given the input values to be performed by the program,the output values are either correct or incorrect. The assumption of many software reliability growth models is the independence among successive software runs but the dependence is a common problem in software components. |
| There are three types of dependence are considered. |
| 1.The dependence between the outputs of software modules were considered. |
| 2.The dependence between successive acceptance test execution among the software modules |
| 3.The dependence is clustering in the input data stream. |
| The existing architecture based models are categories into three types:state based,path based and additive.The state based models are used to represent software architecture by using the control graph and predict the reliability.The path based models are estimate the software reliability based on the possible execution paths of the program.The execution paths can be determined using simulation or algorithmically by executing the application.additive models using the non-homogeneous poisson process(NHPP) to model the each component reliability. |
| Among the three categories of architecture based software reliability models,comparing the other two approaches the state based models are explored to greater extent. A systematic classification scheme for state based approaches to reliability prediction.In state based models the architecture of the application is modeled either as a discrete time markov chain(DTMC),or the continuous time markov chain(CTMC).Majority of the contemporary approaches are assume that component failures are independence with each other but in practically,the components are dependance only.Therefore, to overcome this limitation,a COCF model is introduced for software components under the framework of software architecture, so that the interactions among the components and their failures may be considered in an integrated manner[2]. |
| This paper presents an efficient and scalable approach based on the Multivariate Bernoulli(MVB) Distribution [3] to analyze the reliability of a software application with COCF.The existing techniques are introduces a exponential number of parameters.The proposed methodology produces only a quadratic number of parameters and it eliminates the bottleneck of the contemporary approaches. |
II.RELATED RESEARCH |
| The user oriented software reliability model was proposed by Roger C.Cheung[4] to measure the reliability of a software system based on the user environment and a simple markov model is formulated to determine the reliability of a software system based on the individual module. The beta-binomial distribution is modeled for correlated failures in the multiversion software and a combinatorial model to predict the reliability of a multiversion software system and the community error recovery scheme is used for increasing the reliability of multiversion software was proposed by Nicola and Goyal[5].A methodology proposed by Goseva and sunil kamavaram[6] for uncertainty analysis of architecture based software reliability models for large complex component based applications. |
| The recovery blocks are used to modeling the software fault tolerance technique was proposed by tomek and trivedi[7]. we use the intensity distribution introduced by Eckhardt and Lee.we introduce a new method for generating the intensity distribution and it is based on the pairwise correlation between the modules. The NHPP based SRGM(software reliability growth model)for NVP(N-version programming)systems are proposed by Teng and Pham[8].The reliability growth model for NVP systems are considers the error introduction rate and the error removal efficiency.we proposed a framework for state based models[2] for architecture based software reliability prediction. The state models are represented either as a discrete time markov chain(DTMC), or a continuous time markov chain(CTMC) these models are used to represent the architecture of the application and the model used to define the failure behavior of the components of the application and analysis method. |
III.ARCHITECTURE BASED ANALYSIS |
| In this section,we provide a overview of the architecture based reliability analysis of a software application.The architecture of the software is represented by a absorbing continuous time markov chain(CTMC) and exponential distribution for the execution time per visit for each component.The terminal states C and F which represent successful and failure of the application.For every node i,directed arc from i to j is created with rate μipij, where pij is the probability that the control is transferred from successful execution of component i to component j . The parameters are the mean execution time of a component i given by 1/μi. Each component fails with constant failure rate λi. |
| Let Ri denotes the state of the component i. The Ri can take one of two values 0, or 1,its represents the success or failures of the component. We assume that the execution of the application starts with component 1, and terminates with the n components. Thus, state 1 is consider as the initial state and state n is consider as the final state and the absorbing state of the CTMC. Prevalent architecture based analysis approaches are consider the following assumptions. |
| ïÃâ÷ The components are based on the two possible states: success and failed |
| ïÃâ÷ The executing component failure results indicate application failure |
 |
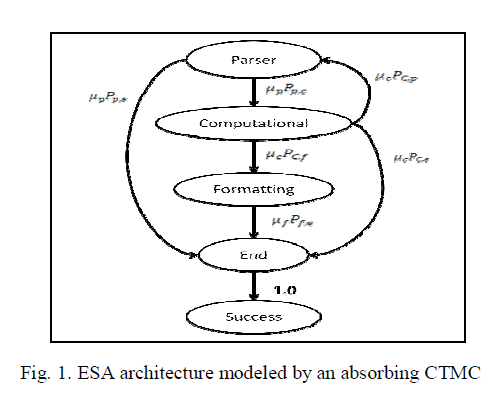
| We illustrate the architecture based approach through an example application from European Space Agency (ESA)[6] and its architecture is shown in the figure. 1. It can be modeled based on the absorbing CTMC. It is assumed that the failure rates are much smaller than the execution rates,and thus many exchanges of controlare expected to take place before a failure occurs,that is, the execution process converges towards steady-state before a failure is likely to occur.The construction of the markov point process is as follows.consider an n+1 state CTMC with n transient states and one absorbing state.The generater Q* obtained after the absorbing state is irreducible and describes the CTMC obtained by the original CTMC using the same initial probabilities, whenever an absorption into state n+1 occures. |
| The parser is the initial component of the application and it is used to encounters a syntax error within the module and reporting errors to the user. The system proceeds to the computational module which is used for transforming the data and optimization are performed.The system produces the output to user. If the output is correct,the computational module will proceed directly to the end state. If the end state is reached , than the application is said to be reliable. |
| The transition probability matrix represented by pij(t) i and j are represent the components and t represents the execution time and the components in Fig. 1 can be represented as |
 |
| It is also used to compute the ESA reliability for some set of parameter values and to derive an analytical expression because it changing the parameter values using sensitivity analysis.The sensitivity analysis is very useful in design phase when the application and component parameters are highly uncertain,and the different parameters on the application reliability can be assessed.The application can provides language oriented user interface,which allows the user to explain the configuration of an array of antennas.The application purpose is to prepare a data file based on the predefined format and characteristics from the user.The array antenna configuration described using the array definition language. |
IV.MULTIVARIATE BERNOULLI DISTRIBUTION |
| MVB distribution can represents the component reliability μ and the pair-wise component correlations, which can be represented using the correlation matrix Ãâ é. We encode the MVB parameters of the components are represented as the functions of independent Poisson variables. The probability mass function of the Poisson process |
 |
| Where k is the number of occurrence of event, t is represents the time between failures and λ>0 is the rate of occurrence of event as shown in equation (1). If one of these Poisson variables experiences one or additional events, then all correlated components are assume this variable fail. We must consider the probability of zero events to encode the MVB parameters. |
| We demonstrate this encoding process using an example of a three component system based on the component reliabilities<μ1=0.909,μ2=0.936,μ3=0.968>, and the correlation matrix |
 |
| To encode these MVB parameters, the Poisson rates are represented in the matrix Λ1.This upper diagonal illustration is sufficient as a result of the matrix is symmetrical |
 |
 |
 |
 |
 |
V.ALGORITHM |
| The selective characterization rule starts with the situation where all poisson variables expertise zero events.under this situation,all the system parts are reliable,resulting in a reliable system.Ranging from this primary situation,we tend to consistently set poisson variables to one, and explore the mixtures in a manner that will increase the amount of piosson variables is about to one,whiches ends in associate application failures.The goal of the algorithm is to search out those combinations of poisson variable that contribute to system reliability,whereas considering the fewest combinations that result in associate unreliable system.The selective characterization method described on top of will be formally described as follows.Take into account a combination of poisson variables,that maps to associate outcome of the joint distribution that produces system failures.The selective characterization algorithm following some steps to provide system reliability estimate.It accepts as input the set of token cuts of the system,which might be determined supported the system design using any efficient algoritm[10]. |
| ïÃâ÷ The algoritm starts with the state whenever Y is all zeros.This is the combinations of all poisson variable expertise zero events,resulting in all reliable components.This state forms the basis node at level zero of the selective characterization tree,and can contribute to software application reliability. |
| ïÃâ÷ The first iteration produces n(n+1)/2 children of the root node.In every of those nodes,one distinct poisson variable is ready to at least one. |
| ïÃâ÷ The algorithm also checks if this set contains a cutset of the system.If the node contains the cutset,then the combinations does not contribute to system reliability and its children never contribute to application reliability. |
| ïÃâ÷ When every of the nodes at level one in all the tree has been evaluated,the set of the nodes that didn’t produce a system failure area unit explored any. |
| ïÃâ÷ When every of the nodes at level one in all the tree has been evaluated,the set of the nodes that didn’t produce a system failure area unit explored any. |
| ïÃâ÷ The failure sets is compared with the cutsets of the design,and the node is eliminated from any thought if the union of the failure sets ends up in system failures. |
| ïÃâ÷ Normally,level of the tree considers combinations wherever of the poisson variables expertise one or additional events. A node that contribute to the system reliability also can be a leaf once the quantity of variables remaining to be explored. |
| The algorithm terminates once no node will be elaborate further. This rule ensures that the formula discovers all combinations that contribute to system reliability. |
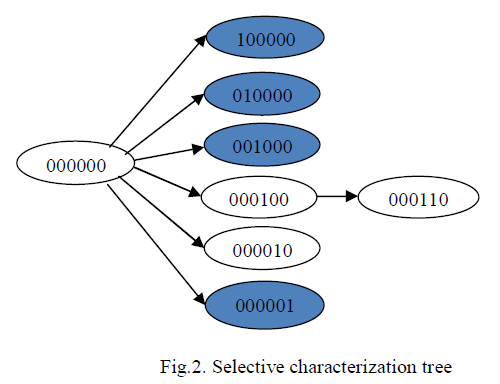
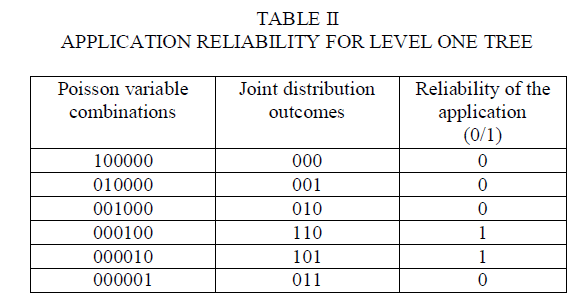
| Fig.4. shows the tree created by the selective characterization rule. The rule constructs the basis node. It then creates six children nodes, one for every Poisson variable. Table II shows the computations of the Poisson variables at the primary level. For every combination, the table includes |
| ïÃâ÷ The result of the joint distribution it maps to Poisson variables |
| ïÃâ÷ Whether or not the node contributes to application reliability. |
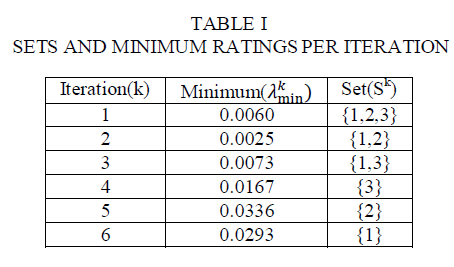
| The first, second, third, and sixth nodes are leaf nodes containing cuts. Referring back to Table I, determined that all three components fail once Y1=1.As a result, the two nodes 000100 and 000010 that contribute to application reliability. Thus, the computation at the second level of the tree includes the node 000110. This node contribute to system reliability and it is corresponds to the outcome 100. We compute the probability for each outcome, and combine these probabilities based on the total probability formula to estimate the system reliability |
| Where Pr{R} represents probabilities of the outcome of component and E[A]̢̉̉R represents the conditional probability of the application for each component outcomes and multiplying these conditional probabilities by the probability of the component outcomes, and aggregating the results of unconditional probability from equation (5) that leads to a system reliability estimates of E[Acorr]=0.8864. E[Acorr] represents the application reliability with correlation. |
 |
 |
VI.SENSITIVITY ANALYSIS |
| Sensitivity analysis is important to assess the sensitivity of the application reliability and performance.It is also useful for optimization of software and bottleneck analysis of components[9].The values of input parameters for the model are unknown during the design stage of the development. The sensitivity analysis can be used to analyzing the influence of the change in input parameters on the reliability metrics and the performance.This analysis used to identify the most critical components that prioritize improvements based on the limited resources. |
| In sensitivity analysis the correlation parameters can identify the impact of reducing or eliminating a pairwise correlation on application reliability. It is inefficient in the contemporary approaches because it introduce an exponential number of correlation parameters.This model indicates how to improve the system reliability by evaluating the sensitivity of the system reliability.The sensitivity analysis techniques are developed to determine the most critical components to system reliability.The applications of this model to determine the expected penalty cost of failures and to develop the cost effective testing strategies.The sensitivity analysis can vary certain parameters of the architectural model and observe the effects on the prediction results. The sensitivity of the reliability estimate to the individual model parameters and then estimate the application reliability. |
VII.CONCLUSION AND FUTUREWORK |
| This paper presents an efficient approach to assess the reliability of the software component based application using CTMC, considering the application architecture, individual component reliability and correlations between the software components. The approach relies on associate algorithm that transforms a multivariate bernoulli distribution into a joint distribution of the components [11]. The approach improves upon existing models by selective characterizing only those outcomes of the joint distribution that contributes to system reliability. The effectiveness of the approach was demonstrated using the ESA application. Because of its potency, the approach is additionally appropriate for analyzing the sensitivity of the system reliability to components and correlation parameters. Our future analysis consists of extending the MVB-based approach to get analytical expressions for application reliability, which will any enhance the potency of reliability and sensitivity analysis. |
References |
|