ISSN ONLINE(2278-8875) PRINT (2320-3765)
ISSN ONLINE(2278-8875) PRINT (2320-3765)
| Dr.T.V.U.Kiran Kumar HOD, Dept of ECE, Bharath University, Chennai – 600073, India |
| Related article at Pubmed, Scholar Google |
Visit for more related articles at International Journal of Advanced Research in Electrical, Electronics and Instrumentation Engineering
Statistical Process Control (SPC) charts are graphs that is used in industries to process data and to help understand, control and improve processes. It is based on statistical theory that is easy for practitioners to use and interpret. Control charts are valuable for analyzing and improving the process outcomes. In this work, SPC tool X-bar chart is used to analyze the present process and process capability is calculated to improve the performance of the process to eliminate the error and to improve the process automatically using data acquisition system. Using LVDT setup the data’s are measured, hence there is no need for the production process to be stopped during inspection. With this setup, the inspection process is automated and the offline statistical process control is converted into online statistical process control method.
Keywords |
| SPC, X-bar Chart, Process Capability, Automation |
INTRODUCTION |
| Three types of quality can be considered: quality of design, conformance and performance. The difference between goods and services with the same basic purpose is given by the Quality of design. Quality of conformance is the ability of a process to meet the specifications set forth by the design. How well the product or service actually performs in the market place is given by Quality of performance. Statistical Process Control is a method of monitoring a process during its operation in order to control the quality of the products while they are being produced—rather than relying on inspection to find problems after all the process is over. |
| SPC is both a data analysis method and a process management philosophy, with important implications on the use of data for improvement rather than for blame, the frequency of data collection and the type and format of data that should be collected. The need for SPC is the manufacturing organizations are looking to help them with the following areas of improvement in product quality, reduction of scrap and rework, increase in manufacturing yield, meeting the customer requirements and managing the change of plan ahead [2]. |
| A goal of SPC is to make ones processes as stable as possible. The objective is to assure that services are consistent as per the requirements given by the customer. By reducing variations within a process stability is guaranteed [3]. There are two types of variation; common cause variation and special cause variation. In order to remove common cause variation fundamental changes are needed and special cause variation is caused by sources that are not inherent in the process. Pareto principle can be applied only after the causes of variation in a process have been found. |
METHODOLOGY |
2.1. Control Charts |
| A control chart is a graphical display of a measured quality characteristic. A fundamental principal of SPC is that the emphasis to control the process. The basic purpose of all quality control charts is to eliminate the causes and reduce variation. The first way variation is reduced by eliminating or correcting the cause of quality problems that is the measurements outside the limits. The second way variation is to reduce variation within the control limits so the limits get closer and closer to the chart central value. In constructing the control charts, the measurement is plotted on the vertical axis and the sample (subgroup, subsample or sample number) is recorded on the horizontal axis. |
| There are at least 27 types of control charts which is divided into two categories: charts for variables and charts for attributes. All variable control charts must track only one quality characteristic of one product on the same chart. Attributecharts can only provide non-conformance information on characteristics outside of specifications. The specification limit is the only constrain for a variable chart. |
2.1. Process Capability and Capability Index |
| The Process Capability is a property of a process to describe the specification, where the process capability index is expressed (e.g., Cpk or Cpm) or as a process performance index (e.g., Ppk or Ppm). The output of this measurement is usually illustrated by a histogram and calculations that predict how many parts will be produced Out of Specification (OOS). Process capability is also defined as the capability of a process to meet its purpose as managed by an organization's management and process definition structures ISO 15504. Two parts of process capability are: Measure the variability of the output of a process, and Compare that variability with a proposed specification or product tolerance. |
EXISTING INSPECTION PROCESS |
| In existing process, the data’s are calculated manually and based on the measured value, X-bar chart is drawn to study the variation in the process and process capability and process capability index values are determined for analysis. Fig. 1 shows the flowchart of the existing inspection process of wheel rim. |
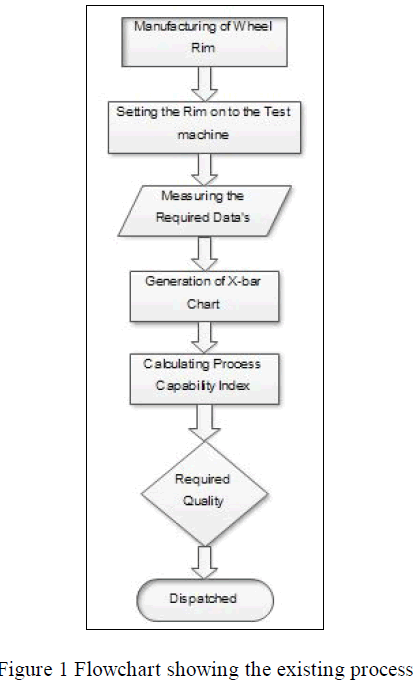 |
| Initially the wheel rim is mounted manually in a rotating shaft. The rim is rotated by a person and the other person takes the readings using the dial gauge. The top wobble is calculated by keeping the dial gauge in the top of the outer cone and the bottom wobble in the bottom of the outer cone. Similarly the top and bottom lift is calculated by placing the dial gauge in the top and the bottom of the inner cone of the rim respectively. Once all the readings are taken they are tabulated. Based on the values determined, X-bar chart is drawn. While taking the readings for a set of rims the production has to be stopped which results in heavy loss. During this inspection process, the whole production process needs to be stopped as the wheel needs to be taken from the production spot to the analysis spot. |
PROPOSED METHOD FOR PROCESS IMPROVEMENT |
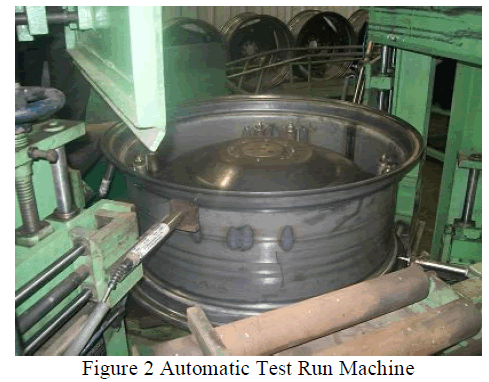
| A LVDT with four probes is connected to the automatic test run machine in which the wheel rim is attached. This set up is connected to a personal computer through which the data’s are collected online. These readings were send to the quality department by using the LAN link up. The rims for which the inspection should be carried out is moved through a conveyor belt system and loaded into the machine having LVDT with four probes, since it is easy to automate the system. The data’s from Top Lift, Bottom Lift, Top Wobbling and Bottom Wobbling are taken from the test rim and directed send to the attached computer. This computer installed with the DATALYSER software checks; either the readings match the given tolerance or not. This compared result is send to the quality department automatically by using the LAN link up. When the rim enters into the test run machine, the probes in the LVDT automatically senses the lift and wobble and take the readings. These readings were send to the computer which is kept near the machine. The computer is already installed with the DATALYSER software. Fig. 2 shows the wheel rim loaded into the automatic test run machine for inspection purpose. |
 |
RESULTS |
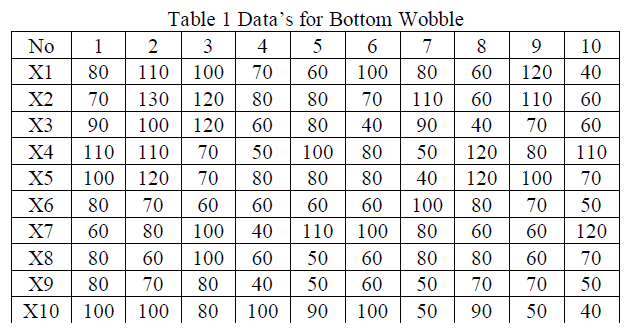
| The bottom wobble of the rim is measured by using the LVDT setup for 100 samples. There are 10 subgroups of 10 samples each. The measured values are given in Table 1. |
 |
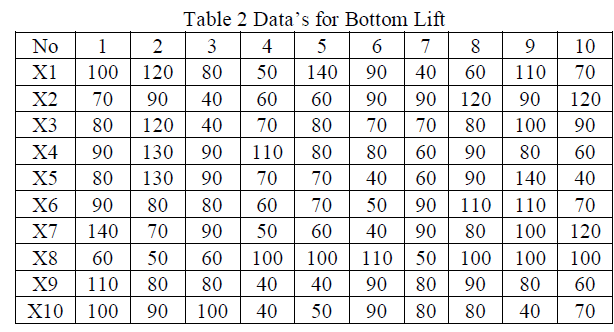
| Table 2 shows the measured values of bottom lift using the LVDT and the X-bar chart is drawn for the measured values. |
 |
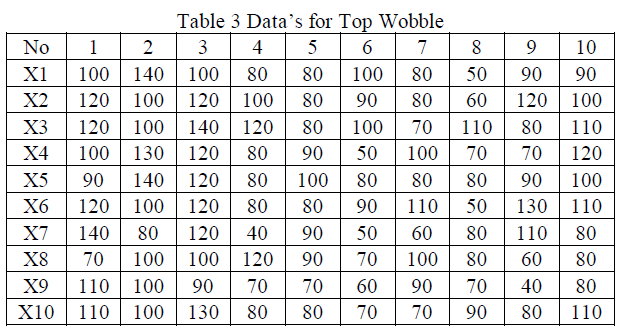
| The measured values for Top wobble are provided in Table 3 for 100 samples chosen for analysis. |
 |
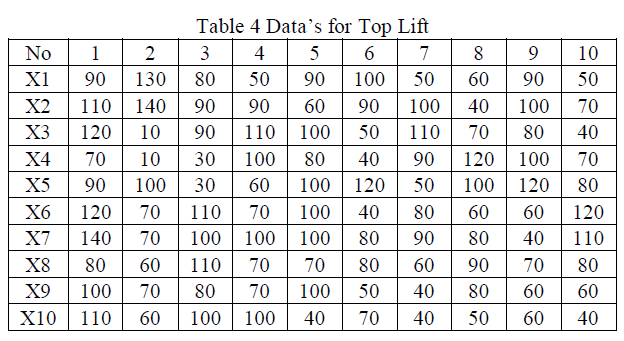
| For top lift, the measured values are given in Table 4, based on which the upper control limit and lower control limit are calculated and X-bar chart is drawn for analysis purpose. |
 |
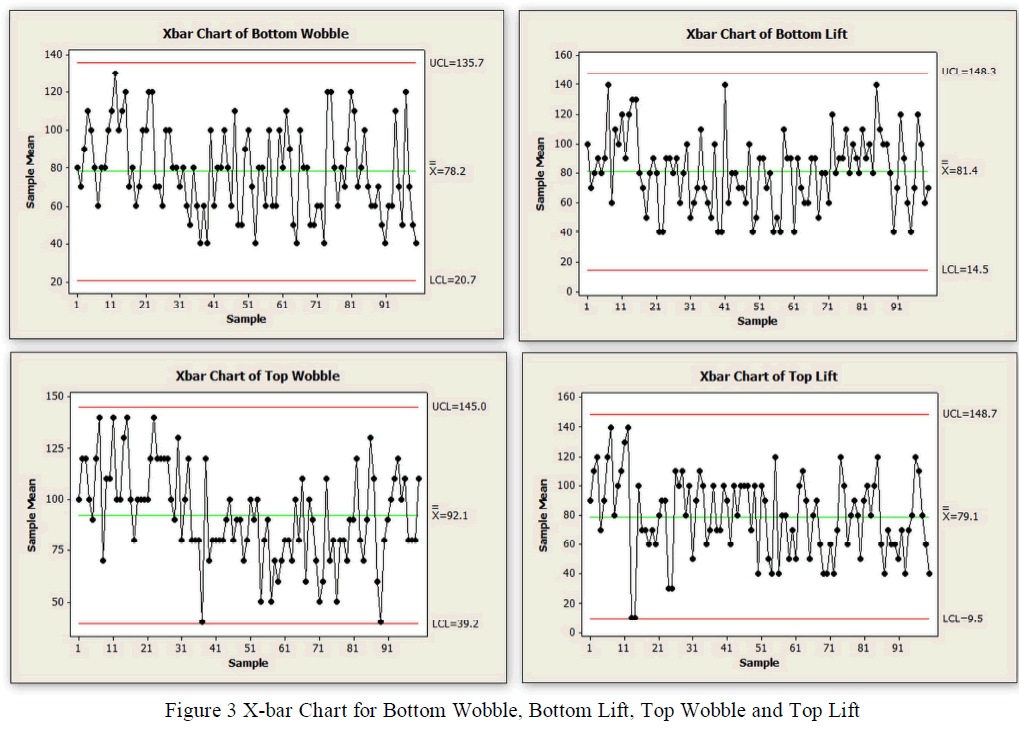
| The X-bar chart for bottom wobble generated using Minitab-16 is shown in Fig. 3. It is inferred that the process mean and variation are stable and no subgroups are out of control. The precision of the control limits is good because of 100 data points included in the calculation of X-bar chart. From the X-bar chart drawn for bottom lift, it is observed that the sample 7 of subgroup 1, sample 1 of subgroup 5 and sample 5 of subgroup 9 lies very close to the upper control limit but no subgroups are out of control which shows that the variation are stable within the limits. It is visualized from the X-bar chart of top wobble that some samples of subgroups 1 and 2 is very closer to the upper control limit and sample 7 of subgroup 4 and sample 9 of subgroup 9 are very nearer to the lower control limit, but none of the samples are out of control. The control limits on the X-bar chart for top lift is too wide for the data. This condition is likely caused by stratified data, which occurs when we have a systematic source of variation within each subgroup. The data collection strategy should be examined for possible sources. Sample 7 of subgroup 1 and sample 2 of subgroup 2 is very close to the upper control limit. Samples 3 and 4 of subgroup 2 lies on the lower control limit itself. |
 |
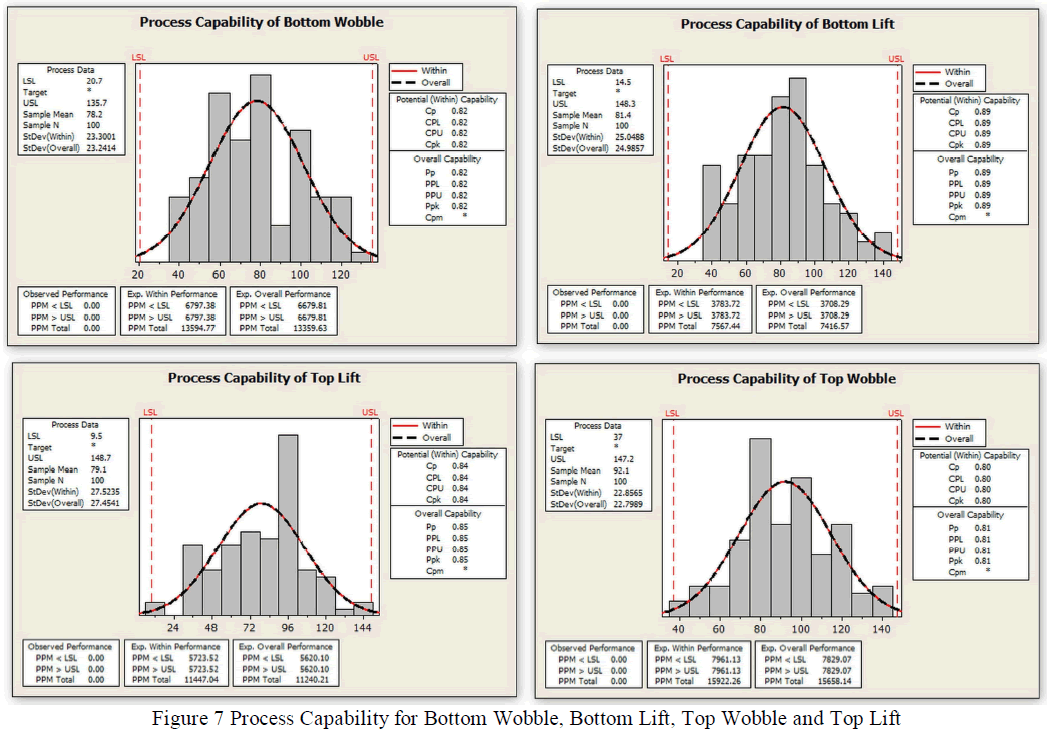 |
| Figure 7 shows the process capability histogram for bottom wobble, bottom lift, top wobble and top lift. The process capability index for bottom wobble is 0.82, bottom lift is 0.89, top wobble is 0.80 and top lift is 0.84. For bottom wobble and bottom lift, the histogram is skewed towards left. For top lift, the histogram is even expect for the data’s range on 90 to 100. A left skewed histogram is obtained for top wobble. From this it is observed that the process is in control and the inspection process can easily be automated using this setup. |
CONCLUSION |
| In this work, the inspection of wheel rim of an automobile is automated using an automatic run test machine and the calculations, conversion of offline statistical process control to online be done by datalyzer successfully. Thus the time taken for inspection is reduced and the production is not stopped during the inspection. Therefore the production rate increases and the time consumption is reduced. And by datalyzer the statistical process control is made online and hence the process stability is done instantly as the datalyzer provide LAN link-up. |
References |
|