ISSN ONLINE(2278-8875) PRINT (2320-3765)
ISSN ONLINE(2278-8875) PRINT (2320-3765)
Kirti A. Yadav1, Minakshee Patil 2
|
| Related article at Pubmed, Scholar Google |
Visit for more related articles at International Journal of Advanced Research in Electrical, Electronics and Instrumentation Engineering
The voice signal contains lot of information. Direct analysis and synthesize of this speech signal becomes complicated. Therefore voice and speech processing approaches generally have feature extraction and feature matching concept. In computer science, speech recognition (SR) is the translation of spoken words into text. The term voice recognition refers to finding the identity of "who" is speaking, rather than what they are saying. For password verification systems we require both speech as well as speaker identification. This approach is implemented in this paper. Here Mel-frequency cepstral coefficients (MFCC) of recorded speech are stored and then trained accordingly to obtain speech as well as speaker verification for password verification system. With the help of the Euclidean distance we measure the distance between two points of trained data and test data to verify a password spelled by a specific speaker
Keywords |
| Euclidean distance (ED), Mel-frequency cepstral coefficients (MFCC), centroid, mean and standard deviation |
INTRODUCTION |
| The term "biometrics" is derived from the Greek words bio (life) and metric (to measure). Biometrics refers to the automatic identification of a person based on his/her physiological or behavioural characteristics. This method of identification is preferred over traditional methods involving passwords and PIN numbers for its accuracy and case sensitiveness. A biometric system is essentially a pattern recognition system which makes a personal identification by determining the authenticity of a specific physiological or behavioural characteristic possessed by the user. An important issue in designing a practical system is to determine how an individual is identified. Depending on the context, a biometric system can be either a verification (authentication) system or an identification system. Verification involves confirming or denying a person's claimed identity while in identification, one has to establish a person's identity. Biometric systems are divided on the basis of the authentication medium used. They are broadly divided as identifications of Hand Geometry, Vein Pattern, Voice Pattern, DNA, Signature Dynamics, Finger Prints, Iris Pattern and Face Detection. In computer science, speech recognition (SR) is the translation of spoken words into text. It is also known as automatic speech recognition, computer speech recognition, speech to text, or just STT. Some SR systems use "training" where an individual speaker reads sections of text into the SR system. These systems analyse the person's specific voice and use it to fine tune the recognition of that person's speech, resulting in more accurate transcription. Systems that do not use training are called "Speaker Independent" systems. Systems that use training are called "Speaker Dependent" systems. Speech recognition applications include voice user interfaces such as voice dialling (e.g. "Call home"), domestic appliance control, search (e.g. find a podcast where particular words were spoken), simple data entry (e.g., entering a credit card number), preparation of structured documents (e.g. a radiology report), speech-to-text processing (e.g., word processors or emails), and aircraft (usually termed Direct Voice Input).The term voice recognition refers to finding the identity of "who" is speaking, rather than what they are saying. Recognizing the speaker can simplify the task of translating speech in systems that have been trained on specific person's voices or it can be used to authenticate or verify the identity of a speaker as part of a security process. Speech recognition is also one of the important factors which can be considered during behavioural characteristic possessed by the user to recognize a voice. This approach can be used for password verification system we have to verify both speech as well as speaker. Section II will give brief introduction to block diagram of the system. Section III will give the results obtain for password verification using two speakers. Section IV will include the conclusion and section V will include references used for this implementation. |
BLOCKDIAGRAM OF THE SYSTEM |
 |
| Figure 1 shows the general block diagram of the system. The block diagram is divided in two phases. One is training and the second is testing. For training the different speech signal, we have stored Mel-frequency cepstral coefficients(MFCC). In sound processing, the mel-frequency cepstrum (MFC) is a representation of the short-term power spectrum of a sound, based on a linear cosine transform of a log power spectrum on a nonlinear mel scale of frequency. Mel-frequency cepstral coefficients (MFCCs) are coefficients that collectively make up an MFC. They are derived from a type of cepstral representation of the audio clip. The difference between the cepstrum and the melfrequency cepstrum is that in the MFC, the frequency bands are equally spaced on the mel scale, which approximates the human auditory system's response more closely than the linearly-spaced frequency bands used in the normal cepstrum. This frequency warping can allow for better representation of sound. |
A. MFCC FEATURE EXTRACTION: |
 |
| The general block diagram for extraction of MFCC features consist as shown in figure 2.The basic five operations are carried on speech signal to get the cepstral coefficients. These five operations are performed as explained below. |
Framing |
| The process of segmenting the speech samples obtained from analog to digital conversion (ADC) into a small frame with the length within the range of 20 to 40 msec. The voice signal is divided into frames of N samples. The first frame consists of the first N samples. The second frame begins M samples after the first frame, and overlaps it by N – M samples. Similarly, the third frame begins 2M samples after the first frame (or M samples after the second frame) and overlaps it by N - 2M samples. This process continues until all the speech is accounted for within one or more frames [1]. The values for N if taken as N = 256 (which is equivalent to ~ 30 msec) [1]. In our implementation we have chosen N=200 which is ~ 25 msec frame. |
Windowing |
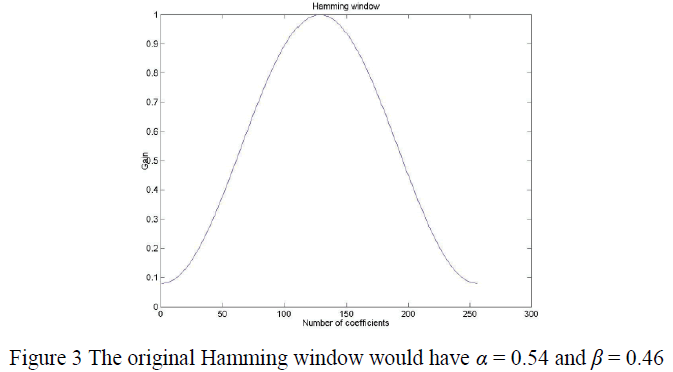
| The next step in the processing is to window each individual frame so as to minimize the signal discontinuities at the beginning and end of each frame. The concept here is to minimize the spectral distortion by using the window to taper the signal to zero at the beginning and end of each frame. If we define the window as w(n), 0 ≤ n ≤ N −1, where N is the number of samples in each frame, then the result of windowing is the signal, |
| Typically the Hamming window is used which can be obtained from following equation [6]. |
 |
| Where α=0.54 and β=0.46 |
 |
| Hamming window is commonly used in narrowband applications, such as the spectrum of a telephone channel. In summary, spectral analysis involves a tradeoffs between resolving comparable strength components with similar frequencies and resolving disparate strength components with dissimilar frequencies. Now after windowing we have obtained N samples in time domain. Windowing the data makes sure that the ends match up while keeping everything reasonably smooth, this greatly reduces the sort of "spectral leakage" described in the previous paragraph. |
Fast Fourier Transform (FFT) |
| The next processing step is the Fast Fourier Transform, which converts each frame of N samples from the time domain into the frequency domain. It is the domain for analysis of mathematical functions or signals with respect to frequency, rather than time. A given function or signal can be converted between the time and frequency domains with a pair of mathematical operators called a transform. An example is the Fourier transform, which decomposes a function into the sum of a (potentially infinite) number of sine wave frequency components. The 'spectrum' of frequency components is the frequency domain representation of the signal.The Fourier transform can be considered to be a bank of band-pass filters that takes in a signal and the magnitude of the output of each filter is proportional to the total input energy into that filter. Each of these filters is convolving the input with a set of filter coefficients that are sinusoidal in nature, with the frequency of oscillation equal to the centre frequency of the filter. When performing the convolution over all the banks, many of the multiplications of data and coefficient values are repeated and therefore redundant[2].Here we have used 512 point FFT |
 |
| We use j here to denote the imaginary unit, i.e. j = −1 . In general Xn’s are complex numbers. The resulting sequence {Xn} is interpreted as follows, the zero frequency corresponds to n = 0, positive frequencies 0<f<Fs / 2 correspond to values 1 ≤ n ≤ N / 2 −1, while negative frequencies − Fs / 2 < f < 0 correspond to N / 2 +1 ≤ n ≤ N −1. Here Fs denote the sampling frequency. The result after this step is often referred to as spectrum or periodogram. [1]. |
Mel-frequency Wrapping |
| The power signal is then applied to this bank of filters called Mel Filter Bank to determine the frequency content across each filter. The Mel frequency filter bank is a series of triangular band pass filters, which mimics the human auditory system. The filter bank is based on a non-linear frequency scale called the Mel scale. The filters are overlapped in such a way that the lower boundary of one filter is situated at the centre frequency of the previous filter and the upper boundary is situated at the centre frequency of the next filter. The maximum response of a filter, that is, the top vertex of the triangular filter, is located at the filter’s centre frequency and is normalized to unity. We can use the following approximate formula to compute the mels for a given frequency f in Hz: |
| The modified spectrum of S(ω) thus consists of the output power of these filters when S(ω) is the input [7]. |
Cepstrum |
| A cepstrum is the result of taking the Inverse Fourier transform (IFT) of the logarithm of the estimated spectrum of a signal. There is a complex cepstrum, a real cepstrum, a power cepstrum, and phase cepstrum. The power cepstrum in particular finds applications in the analysis of human speech. Thus each input utterance is transformed into a sequence of acoustic vector. |
B. EUCLIDEAN DISTANCE MEASURES |
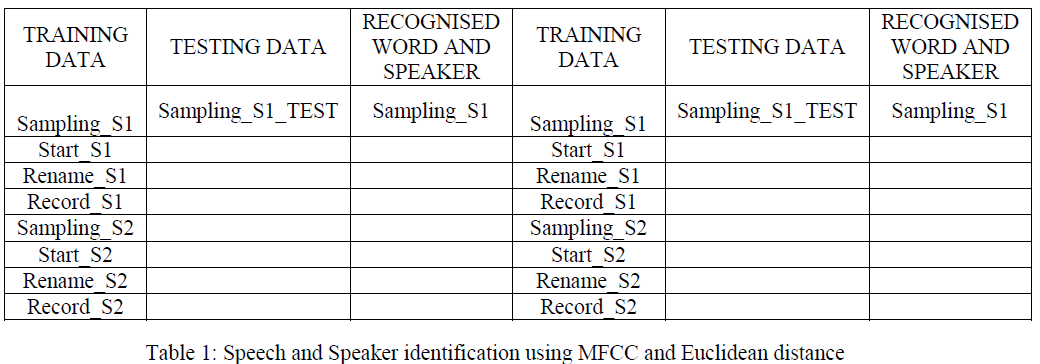
| The MFCC extracted features have been stored for both training and testing signals. Training set consist of four different words spelled by two speakers S1_train and S2_train. The testing phase consist of speech spelled by S1_test or S2_test. |
| Euclidean distance between feature vector x of S1_train and S2_train and S1_test or S2_test is given by [5] |
 |
| where x corresponds to feature vector of S1_train or S2_train and y corresponds to feature vector of S1_test or S2_test. |
RESULTS |
| To test the system, we have recorded speech samples of two speakers S1 and S2.the speech and speaker verification can be seen in table 1 using method MFCC and Euclidean distance. Approximate same results can be seen using mean and standard deviation on MFCC features and also using centroid method. Centroid method assigns centroid to each each speaker spelled word and then during test this stored centroid is compared with the test signal centroid. |
 |
CONCLUSION |
| As seen in the result speech and speaker identification can be done using MFCC and Euclidean distance. Almost same results can be obtained using mean and standard deviation calculation on MFCC values. This approach can be further modified to have best results using vector quantization[4]. |
References |
|