ISSN ONLINE(2319-8753)PRINT(2347-6710)
ISSN ONLINE(2319-8753)PRINT(2347-6710)
R. D. Patil1, Dr. Bimlesh Kumar 2
|
| Related article at Pubmed, Scholar Google |
Visit for more related articles at International Journal of Innovative Research in Science, Engineering and Technology
The paper deals with stress analysis of plates perforated by holes arranged in rectangular plate with square pitch hole pattern. For this, in-plane loads are considered. Photo elasticity models were casted using photoelastic materials for rectangular plate with square pattern of holes. The testing of perforated plates are done by using the polariscope in experimental method. The results obtained by experimental is compared with the Finite Element Method
Keywords |
| Stress Analysis, Photoelastic Material, Polariscope, Finite Element Method. |
INTRODUCTION |
| Equations, which are considered for the structural design of various types of pressure vessels, are mainly based on the strength of material approach. This approach assumes that there is a continuous elastic action throughout the member and the stress distributed on any cross section of the member by a mathematical law. But these assumptions are no longer valid, if geometric discontinuity is present in the section of the member. This geometric discontinuity may be in the form of crack or hole or any cutout of some different shape. This results in great irregularities in the stresses distributed across the section. In other words, stresses of large magnitudes are developed in the small portion of the member. Hence, these stresses are called as the localized stresses or stress concentrations. |
| One such example of localized stresses is a flat plate with a hole, which may be subjected to different types of loads, analytical formulae have been developed to find out the stress concentration effects in this case. But when there are large number of holes in the plate, the problem becomes complicated. Stress distribution around each hole is altered due to interaction effect of other holes. These holes may be arranged in the uniform pattern or they may be arbitrarily oriented. Out of these, holes arranged in the uniform pattern are of practical importance. Such a plate is popularly known as tube plate or tube sheet. |
| Holes in the tube sheet can be arranged in three different patterns. |
| ïÃâ÷ Equilateral Triangular Pattern ïÃâ÷ Square Pattern ïÃâ÷ Staggered Square Pattern |
| Out of these patterns, the equivalent triangular arrangement is the most widely used as it is the most effective packing arrangement. The main objective of the project is to obtain the stress distribution in a flat plate which is perforated by equal circular holes and subjected to uniaxial loads. Square pattern of holes are considered for study. The stress distribution changes with the change in ligament efficiency for any given type of loading. Therefore effect of ligament efficiency on stress concentration factor will be studied for uniaxial loading condition. For the same, Rectangular plate containing 4 X 4 pattern of holes in square pattern i.e. total 16 holes, subjected to uniaxial tension. are considered |
II. STRESS ANALYSIS BY EXPERIMENTAL METHOD |
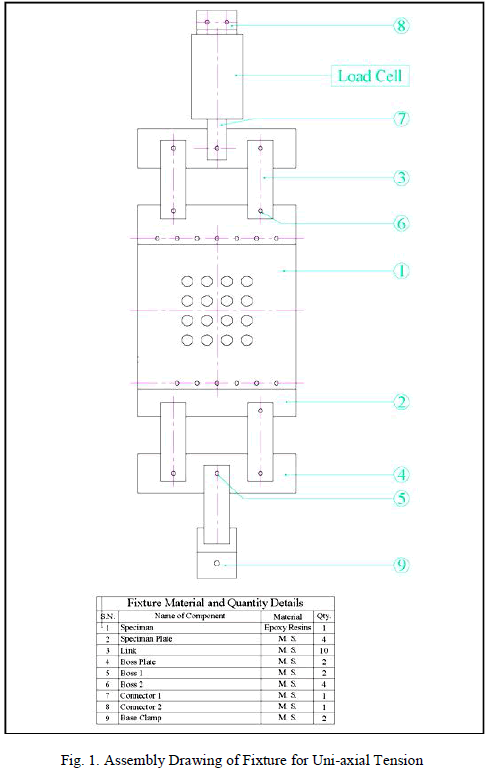
| The main motive of the experimentation was to support analytical and numerical solution. The most commonly used methods for determining stress values experimentally are strain gauges and photoelasticity principles. Overall picture of the stress distribution and regions of both high and low stresses are available for much detailed stress analysis in photoelasticity. This advantage of photoelasticity lays the foundation of experimentation of the dissertation work. To give the uniformly distributed loading i.e. tensile force at the edge of the plate in the principle direction, a fixture has been designed and manufactured with following guidelines. The assembly and details of the fixture are shown in figure 1. Figure 1 shows the modified load frame, mounted in the polariscope. The load frame consisted of a power screw connected to a horizontal square bar of 25 mm size at the topside of the plate. A hole of 11 mm diameter was drilled at the center to hold the frame under experimentation. The load cell is mounted with the help of connector 1 and connector 2 as shown in figure. The load cell was employed to measure the applied tensile force. Application of the load at connector 1 configures in point load. To have the uniformly distributed load, the linkage 4 was incorporated as shown in figure . This enabled the connector 1 to share the load into two parts of the boss plate. The applied load was transferred to the specimen in uniformly distributed way through specimen clamping plates. The clamping plates hold the specimen with the help of 10 mm diameter holes, along the edge as shown in figure 1. Welded boss on each side of plate 2 were provided to ensure proper vertical alignment. The same configuration of linkage as used in the upper edge of specimen was employed at lower edge of specimen to ensure proper fixing and loading. |
 |
| For experimentation Tardy’s method is used. In this method the polarizer of the polariscope is aligned with the direction of the principal stress ïÿýïÿýïÿýïÿý at the point of interest and all other elements of the polariscope are rotated relative to the polarizer so that a standard dark-field polariscope exists. Then the analyzer alone is rotated to obtained extinction. The rotation of the analyzer gives the fractional fringe order. If lower order fringe has to move to the point then add this fraction to lower order fringe number. The result indicated the fractional fringe order of the point of interest. |
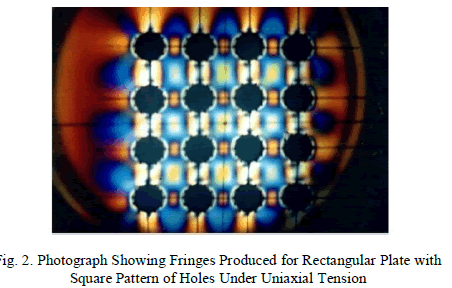
| Analyzer and polariser were kept in crossed position i.e. dark field setup. Model was gradually loaded to observe the fringe growth. Fractional fringe order was measured by Tardy's compensation method. Figure 2 shows the photograph of the fringes produced for rectangular plate square pattern of holes under uniaxial tension.The procedure to find out the maximum stress is given below |
| 1. A circular disk specimen was employed as calibration model and obtained material fringe value, which was near about 11 N/mm2 for each plate. |
| 2. Then point of interest is marked on the specimen and plate was connected to the fixture for loading. |
| 3. The fixture designed for tensile tension was mounted on the polariscope along with the specimen and tensile force was given with the help of power screw. |
| 4. Direction of the principle stress and exact fringe order were determined by using Tardy’s compensation method at point of interest |
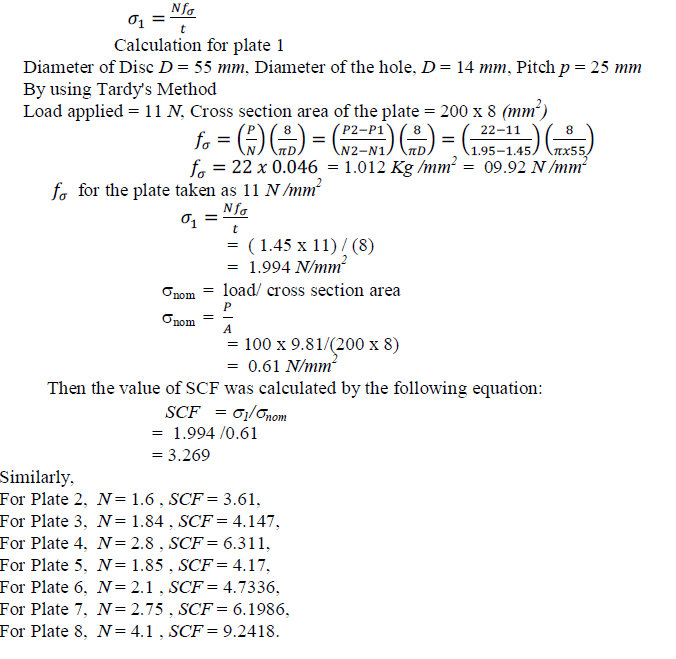
| 5. In this case, the point of interest was at the hole boundary at which the value of ïÃÂó2 = 0 and ïÃÂó1 was determined by the formula |
 |
 |
III. STRESS ANALYSIS BY FINITE ELEMENT METHOD |
| This section illustrates the use of finite element method for numerical calculations to find out the stress concentration in the plates. The rectangular plates containing 4 X 4 pattern of holes in square pattern and diagonal pattern i.e. total 16 holes, have been modeled for simulation purpose and subjected to uniaxially. The results obtained were plotted in the form of curves for validation purpose during the actual experimentation. The SCF values obtained with ANSYS program are in agreement with those obtained by various investigators. Structural analysis module of ANSYS 13.0 is used for analysis with static (P) method. Static (P) method was selected for these cases because it uses large sized and more powerful elements using shape functions up to 8th order. Moreover, elements are relatively unaffected by the distortions and excessive shape changes. Eight node isoparametric quadrilateral elements were used for meshing in all plane-loading problems. In addition to corner nodes, this element has 4 midsize nodes. Therefore, this element was found to be more suitable for modeling curved boundaries such as circular hole in the present analysis. |
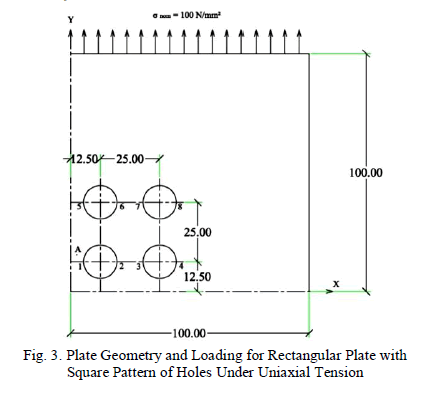
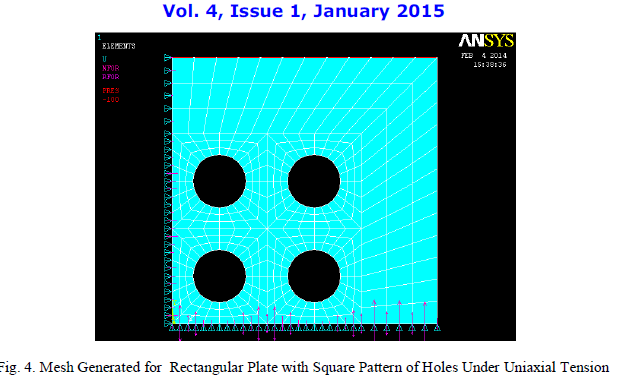
| First analysis has been done for 4 X 4 pattern of holes in rectangular plate subjected to uniaxial tension. Due to symmetry of geometry and load, only one quarter part of the plate was modeled. Figure 3 shows plate geometry and loading for quarter part of the model. For each small area defined, the element size of 3 was specified. This resulted in three divisions for each side of the area and hence 9 elements per area. Then meshing was done with the help of inbuilt meshing facility available with ANSYS program. More fine mesh (i.e. small element size) was used around the boundaries of the holes and at the bottom left corner of the model. Figure 4 shows the mesh generated for the plate model with details regarding number of element and nodes used for analysis. Boundary Conditions : For X Axis , ïÿýïÿýïÿýïÿý ≠ 0, and ïÿýïÿýïÿýïÿý = 0.For Y Axis, ïÿýïÿýïÿýïÿý = 0, and ïÿýïÿýïÿýïÿý ≠ 0, used for the model. |
 |
 |
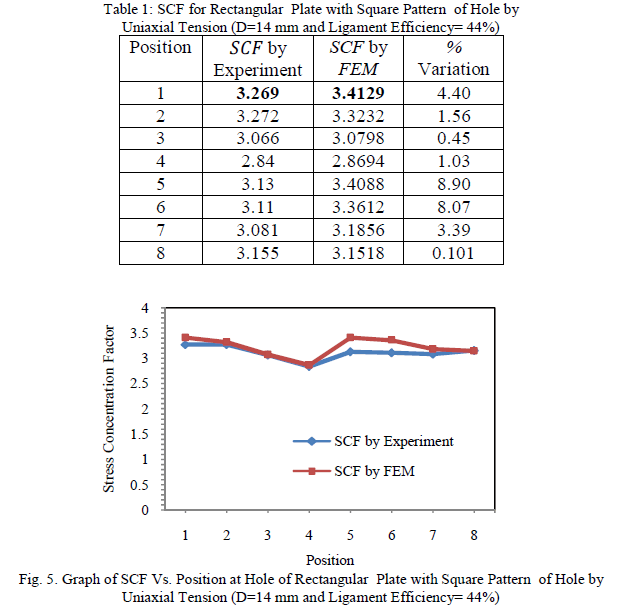
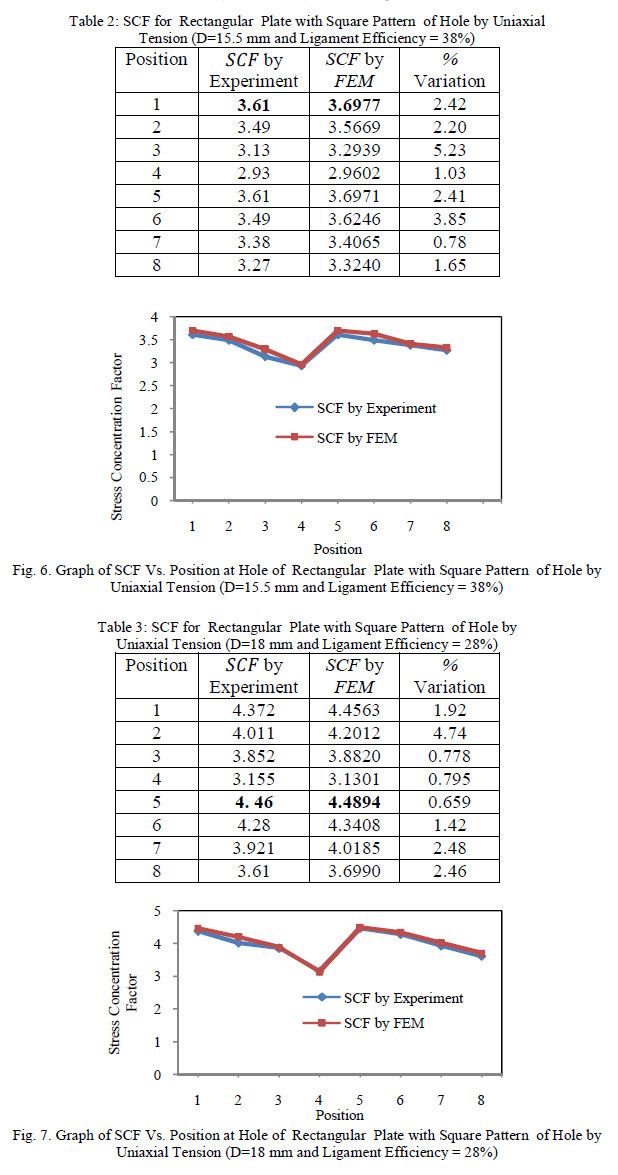
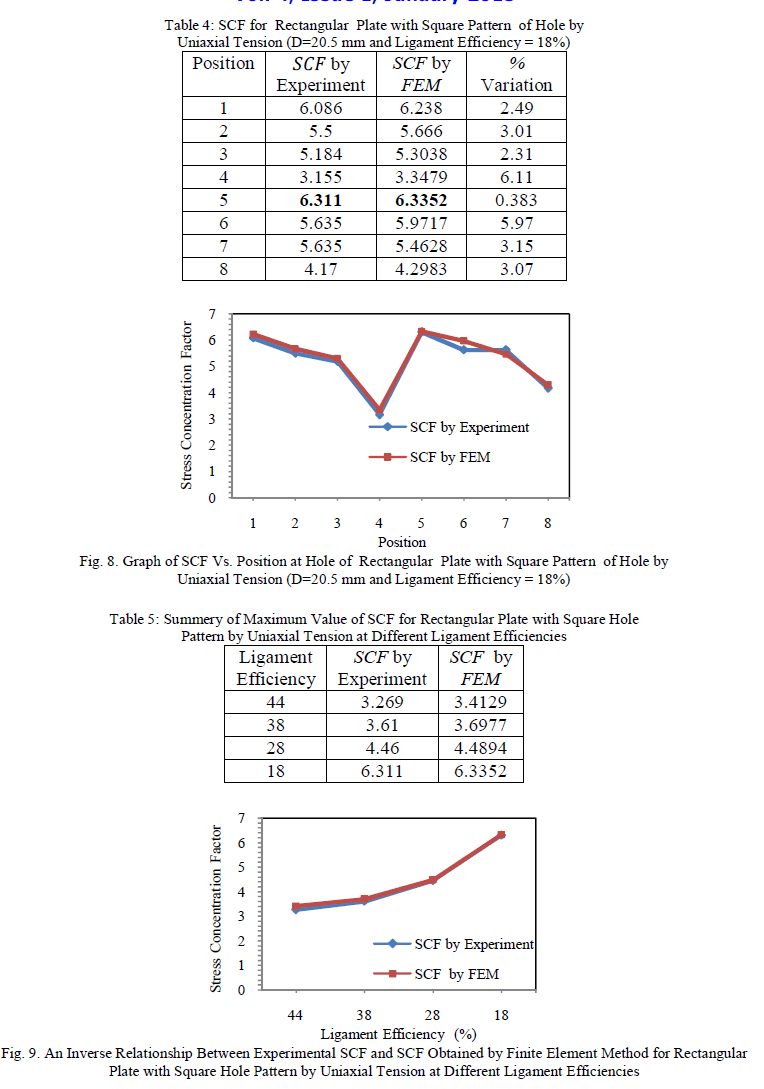
| Tests were carried out on the models with different diameter of holes for rectangular plate with square pattern of holes by uniaxial tension and the results are tabulated in table 1 to 4. In these tables, the SCF values obtained by experimental method on rectangular plate with square pattern of holes are compared with theoretical SCF values obtained by Finite Element Method using ANSYS program. Figure 5 to 8 are shows the graphical presentation of the same. The maximum stress for rectangular plate with square pattern of holes is obtained by experimental method and finite element method are tabulated in table 5. Figure (9) shows the graph of maximum value of SCF versus ligament efficiencies for values given in table 5 by uniaxial tension. |
 |
 |
 |
IV. CONCLUSION |
| While comparing the results with finite element analysis, it is observed that the percentage variations of experimental values with FEM were well below 10%. The difference in the experimental and SCF values by FEM may be attributed to the following reasons: |
| The load applied to the model may not be uniformly distributed over entire cross section of model. Some bending may result due to misalignment of upper and lower clamping plates of the loading frame. |
| a) In spite of extreme care taken in manufacturing of models, small amount of machining stresses are likely to be developed in the model, changing the fringe pattern in the model. |
| b) Fringe order was measured by comparison of fringe colour with colour chart or with colour table. Therefore there is a possibility of misinterpreting the fringe order. |
| c) There was great amount of friction in the pivots of the loading frame. |
| Due to limitations of the loading frame, only rectangular plate models that too in uniaxial tension could be tested. Although analytical formulae have been developed by different workers to find out maximum stresses (SCF) for the tube sheet with a hole. However, as the number of hole increases, the interaction effect of stresses in the holes creates difficulties in the application of this method. Therefore, the FEM and Experimental Method validated during the present investigation may be used to find out maximum stresses in the tube sheet as it gives correct analysis of stress distribution in the tube sheet. |
References |
|