ISSN ONLINE(2319-8753)PRINT(2347-6710)
ISSN ONLINE(2319-8753)PRINT(2347-6710)
T. Penta Rao 1, P. Rajendra Prasad 2, Y. Ganapathi Rao 3, V. Sujatha 4
|
| Related article at Pubmed, Scholar Google |
Visit for more related articles at International Journal of Innovative Research in Science, Engineering and Technology
Mass transfer data were obtained in annular conduit using an electrochemical technique with a potassium ferri-ferro cyanide redox system was chosen as system of the study. In annular conduit coaxially placed entry region spiral coil was used as turbulence promoters presented in this paper. Mass transfer coefficients were evaluated from measuring limiting currents. The study covered wide range of parameters like Effect of Pitch of the coil, Effect of Length of the coil, Diameter of the coil, Diameter of the coil wire, Diameter of the annular rod on mass transfer were studied. A model was developed for mass transfer data. A study is also made on the energy efficiency of the promoter. The Experimental mass transfer function in terms of geometric parameters have been developed and presented here under.
Keywords |
| Mass transfer, annular conduit, entry region spiral coil, turbulence promoter, modeling, augmentation. |
INTRODUCTION |
| Augmentation of heat and mass transfer processes are never ending quest for an engineer or technologist. Augmentation of a transfer processes offer the following advantages. The other advantages are less floor area, ease in handling of raw material and utilities. These factors leads to the reduction unit product cost. Hence the augmentation technique found attractive for researchers. To arrive at this above objective, several strategies have been followed. The earliest augmentative technique is surface roughness [1] several works were reported in literature. Use of baffles [2] and surface alternations also come under this section. Works like spheres [3], fins [4], bluff bodies [5] and stream lined bodies [6] placed across the flow were also extensively found in literature. Flow through ducts and arched channels [7], jets [8] were also encountered. Investigations on insert promoters in heat and mass transfer operations were reported extensively. The work reported was on concentric rod placed in the circular conduit, since then heat and mass transfer studies with coaxially placed turbulence promoters were reported extensively. The investigation on co-axially placed promoters like twisted tapes[9], tapes wound on a rod[10], spiral coils[11], string of spheres[12] and cones[13], discs[14], orifices[15], circular rings places on a rod[16] were also studied. But works found in literature seemed to increase friction there by higher operating costs. This is particularly true for string of spheres, string of cone, string of discs [17], and flow past cylindrical rod (18), across stream lined bodies [19], and many devices like axially displaced promoters, and surface modifiers. In the present study an effort is made in acquiring higher augmentation rate with lower frictional losses. It will lead to the construction of energy efficient transfer operation. Several researchersemployed swirl flow for the augmentation of their process. Therefore an attempt is made to employ swirl motion in achieving this objective swirl flow devices were incorporated in circular conduits and found their effectiveness on heat and mass transfer processes. Among the swirl generating devices twisted tapes [20], tapes wound on a rod [21], spiral coils [11], spiral coils placed on central rod of an annular conduits [22] and tangential entry of fluid are prominent. Among the coaxially placed promoters, Entry region swirl generating promoters received the attention of several researchers. Nageswara Rao V., and Rajendra Prasad P., [23] employed tape, tape-disc assembly as turbulence promoters in their study. Murali Mohan et al [24] used entry region coil and coil-disc assembly as turbulence promoters in circular conduits generated useful data for the augmentation. Present investigation is directed towards achieving energy efficient transfer process. To that effect, it envisaged to obtain mass transfer data at the inner wall of annular conduits along the length of the column. Subsequently, local mass transfer data were obtained and the results were reported. These results could be adopted for enhancing mass transfer processes like electro dialysis [25], ultra filtration [26], reverse osmosis [27] and several other processes and reported increased transfer rates. The electrochemical processes like electro winning [28], electro refining [29], electro milling [30] and electro organic synthesis [31] could employ swirl generating promoters to obtain higher transfer rates. Swirl flows have wide range of applications in various engineering areas such as chemical processes like mechanical mixing and separation devices, combustion chambers, turbo machinery, rocketry, etc. It can be effectively used in heat and mass transfer enhancements. Mass transfer with entry region spiral coil as turbulence promoter was selected for the present study. The parameters covered in the study are presented in Table: 1 |
 |
| A. The study is carried out to obtain the following information. 1. To obtain limiting currents data on the outer wall of an annular conduits with entry region spiral coil as turbulence promoters. 2. To study the effect of geometric parameters on mass transfer namely - pitch of the coil (Pc), length of the coil (Lc), diameter of the coil (Dc), diameter of the coil wire (Dw), and diameter of the annular rod (Di) on the outer wall mass transfer coefficients. B. The following information is derived out of the study. 1. Mass transfer coefficient is increases with increasing in velocity. 2. As the pitch of the coil increases mass transfer coefficient increases up to pitch of 3.6 followed by a marginal decrease. The pitches 1.6, 2.6 have shown a marginal change. 3. Mass transfer is increasing monotonously with increase in length of the coil. 4. The effect of mass transfer coefficient on the diameter of the coil is marginal because marginal variation is only possible. 5. The present study shows maximum augmentation of 10 fold over Lin et al and 1.58 folds over entry region coil without solids. 6. Correlations were developed based on semi theoretical considerations. Wall similarity concept is used in the development of correlations. The following Correlation developed for mass transfer is presented as |
| C. Mass Transfer: |
 |
| This equation is useful for the design and development of energy efficient transfer processes. |
II. EXPERIMENTATION |
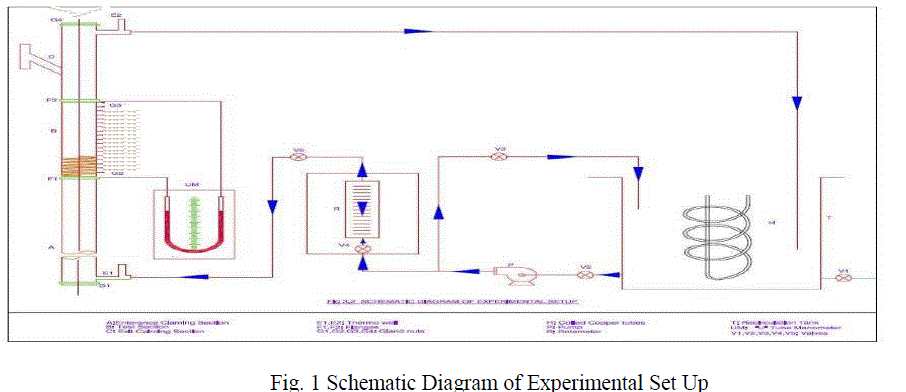
| The experimental setup used for the study was similar to those used in earlier studies [1, 2, 3, 4 and 5]. Schematic diagram of experimental set up is shown in figure: 1. It was essentially consisted of a recirculation tank, an entrance calming section (A), a test section(B), and an exit calming section (C), thermo wells (E1, E2), flanges (F1,F2), gland nuts (G1 to G4), coiled copper tube (H), pump (P), rotameter (R), recirculation tank (T), U-tube manometer (UM) and valves (V1 to V5). The recirculation tank was a cylindrical copper vessel of 100 liter capacity with a drain pipe and a gate valve (V1) for periodical cleaning of the tank. A copper coiled tube (H) provided with perforations. The perforations were meant for bubble of nitrogen through the electrolyte. The bubbling of nitrogen through the electrolyte expels the dissolved oxygen present if any. The tank was connected to the pump with a 0.025 m diameter copper pipe on the suction line of the centrifugal pump. The suction line was also provided with a gate valve (V2). The discharge line from the pump divided into two lines. One line served as a bypass and a controlled by valve (V3) is incorporated in it. The other line was connected to the entrance calming section (A). A control valve (V4) and a rotameter were also incorporated in the line. The control valve was used to regulate the flow of electrolyte. The rotameter served as flow measuring device. The rotameter has a range of 0 to 347x10-6 m3/s. The entrance calming section was circular copper pipe of 0.046 m ID provided with a flange and closed at the bottom with a gland nut (G1). To an extent of 0.1m of entrance calming was filled with capillary tube to damp the flow fluctuations and to facilitate steady flow of the electrolyte through the test section. |
| The details of the test section are shown in figure: 2. it was made of a graduated perspex tube of 0.68 m length with point electrodes fixed flush with the inner surface of an outer wall of the test section. The point electrodes were made out of a copper rod and machined to the size. The electrodes were fixed flush with the inner surface of the outer wall of the test section at an equal spacing of 0.0254m. The diameter of the exit calming section was also of the same diameter. The entrance calming section made of copper tube of 1.8m long, and it was provided with a flange on the upstream side for assembling with the test section. The exit calming is also made of copper tube of length 0.7m and diameter of 0.046m. The exit and entrance calming sections were provided with gland nuts (G2, G3) at the top and bottom ends. The column comprised of three sections namely the entrance calming section, the test section and the exit calming section. These sections were assembled by means of flanges F1, F2. Two thermo wells (E1, E2) were provided, one at upstream side of the entrance calming section and the other at the downstream side of exit calming section to measure the temperature of the electrolyte. |
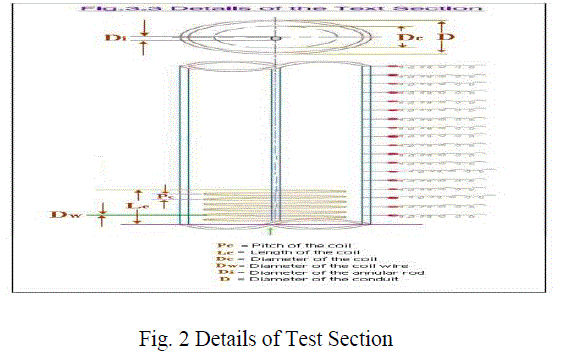 |
| The coil is fixed at the entrance of the test section with the help of flanges. And the central rod is placed inside the column from top to bottom. The entry region coil was a spiral coil made from a copper wire of 0.006, 0.007, 0.008m diameters. The copper wire was coiled to obtain coil diameters of 0.031m, 0.034 and 0.038m. The pitches of the coils were varied as 1.6, 2.6, 3.6, 4.6cm. The spiral coil was welded to a flange. The flange has a matching perforation with that of test section. It is placed concentrically in the test section and fixed via flanged joints. Multimeter of Motwane make with accuracy of 0.01mA was used as an ammeter and another multimeter was acted as voltmeter and has an accuracy of 0.01V. They were used for measuring the limiting currents and potentials respectively. The other equipment used in circuit was rheostat, key, commutator, selector switch and a lead acid battery. The battery served as the power source. The commutator facilitated to reverse the polarity. The measurement of limiting currents for reduction process was taken. The selector switch facilitated the measurements of limiting currents at any desired electrode. |
 |
| D. Experimental Procedure: The limiting current data were obtained for the case of reduction of ferricyanide ion in annular conduit in the presence of entry region spiral coil as insert promoters in homogeneous flow. The cathodic reduction reaction of ferricyanide ion at the reacting electrode is given below |
| Eighty liters of equimolal solution of 0.01 N Potassium ferricyanide and 0.01N Potassium ferrocyanide with 0.5N NaOH as electrolyte was prepared used as the system. The electrolyte was analyzed for ferrocyanide ion concentration by volumetric titration method using standard potassium permanganate solution [1] and for ferricyanide ion using idometric method [2]. The viscosity of the solutions at different temperatures were measured with Ostwald Viscometer and densities were measured using specific gravity bottle. The point electrodes in the test section were polished using four zero emery to get a smooth surface followed by degreasing with trichloroethylene solution. The size of the electrode was measured with a traveling microscope. After fixing the promoter in position, blank runs i.e were conducted with sodium hydroxide electrolyte alone to ensure that the limiting currents obtained were due to diffusion of reacting ions (Ferricyanide ion) only. Subsequently, known quantities of potassium ferricyanide and potassium ferrocyanide were added to get the concentration of electrolyte was maintained at equimolal 0.01M Ferri-ferro Cyanide couple was maintained. The coils of known geometry were fitted at the entrance of the test section by means of flanged joint and the annular rods were fixed by means of gland nuts. The experiments were repeated by replacing the coil and /or annular rod. The electrolyte was pumped at a desired flow rate (through the test section) by operating the control and by-pass valves. After the steady state was attained, potential was applied across the test electrode and wall electrode in small increments of potential (100mV) and the corresponding current values were measured for each increment. As the area of the wall electrode was relatively large in relation to the area of the test electrode, nearly constant potential was obtained at the test electrode. Since the potential values are not of criteria in the present study, the limiting currents only were obtained from the current and potential data. The experiment was repeated by changing the flow rate of the electrolyte and the limiting currents measurements were taken for each flow rate. The experiment was repeated by changing the flow rate of the electrolyte and the limiting currents measurements were taken for each flow rate. Measurement of limiting current: The plots of current versus potential data yields limiting currents. Increase in potential increases the current up to certain value and further increase in potential would be maintained nearly constant current values, which is taken as the limiting current. Mass transfer coefficients were computed from the measured limiting currents by the following equation: |
 |
| Pressure drop measurements for each flow rate were made simultaneously by using a U – tube manometer with Carbon tetrachloride as manometer liquid. |
III. RESULTS AND DISCUSSION |
| This chapter deals with 7500 local limiting current data obtained at the outer wall of an annular conduit fitted with an entry region spiral coil as a turbulence promoter. Local limiting currents at the outer wall of an annulus were measured along the length of the column. Cathodic reduction of ferricyanide ion was chosen as the system for the present study. E. Studies on homogeneous flow with entry region coil in annular conduits: Mass transfer The experimental measurements consists of the flow rate of an electrolyte (Q), limiting current (iL). From the measured current potential data, limiting currents were identified. The concentration of reacting ion (Co) was estimated by idometry. Physical properties of the solution namely density (ρ), viscosity (μ) were measured by suitable method. The values of Diffusivities (DL) were estimated by the method mentioned in experimental procedure. Diameter of the test section (d) and dimensions of the promoter assembly viz., pitch of the coil (PC ), length of the coil (LC), diameter of the coil (Dc), diameter of the wire of the coil (DW), diameter of the annular rod (di) and temperature (T), were measured with suitable instruments. The limiting currents obtained from the study were transformed into mass transfer coefficients using the following expression. |
 |
| F. Local Variation of Mass Transfer along the Length of the Column: Local limiting currents are plotted against distance from the start of the coil which was fixed at the entrance of test section and could be seen in figure: 3. The limiting current value are found to fluctuating little extent with distance indicating oscillatory behavior, but the oscillating tendency is dampened with the length of the test section. It reveals the following information. |
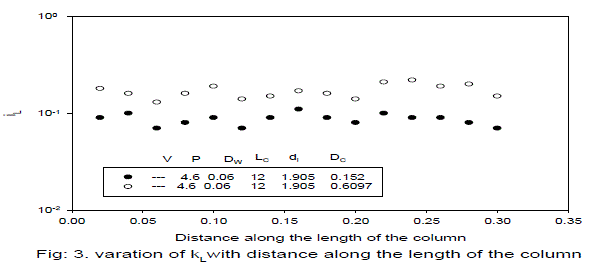 |
| The enhancements in limiting currents are largely uniform along the length of the test section. The augmentation is continuous and nearly uniform with small fluctuations when observed along the length of the column. For much longer distances, the limiting current values would have been decreased if the study continues further along the length of the column and it is supposed to reach that of the conduits with no promoter and no solids. The local iL values were arithmetically averaged and are nearly coinciding with the values computed with integral averaging method and used in the further analysis. Limiting currents are increasing with increase in the velocity. At higher velocities a marginal declining tendency in oscillating behavior was seen from the figure. The data was analyzed in terms of dynamic and geometric parameters of the study. Range of variables covered in this study is given in the table 1. and table 2. |
 |
 |
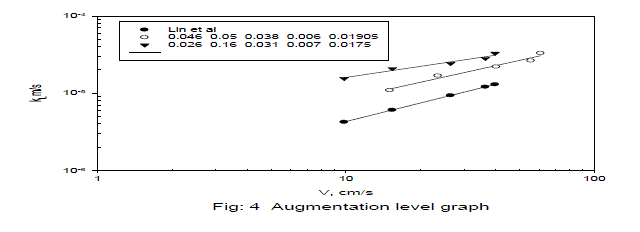
| G. Augmentation Capacity of the Promoter The entire data that forms bound for the study are identified and shown in figure: 4 as plot A is the best augmenting set it mean the promoter geometry with which maximum augmentation is obtainable while plot B is the least augmenting one which mean the promoter with geometric configuration produces minimum augmentation obtainable within the range of variables covered in the present study. The plot C is the data obtained from Lin et al for tube without any promoter. These promoters augment mass transfer rate from 2 folds to 4 folds at a velocity of 10 cm/s while that tapered off 1.67 to 2.5 for the best augmenting one at a velocity of 40 cm/s. |
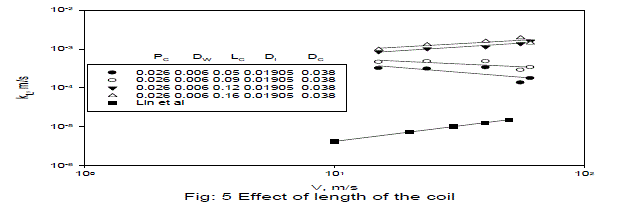
| H. Effect of Length of the Coil (LC): Length of the coil has strong influence on mass transfer. Entry region coils guide the fluid element and transform the axial flow into swirl flow. As the length increases transformation of flow from axial to swirl is intense which can be observed physically at the start of the experiment. The mass transfer coefficient is supposed to increase to a maximum value followed by a decreasing zone as indicated in the earlier study by Murali Mohan et al [21] but in the present case the swirl is increasing in monotonous manner. It may be attributed due to the higher velocities obtainable in annular conduits. Therefore, annular conduits support longer entry region coils to enhance swirl flow. To observe the possible peak Lc value, further study is required with larger length of the coil. The figure: 5 reveals as the length of the coil increases mass transfer increases. The coils with LC=12, 16 has reasonably higher augmentation. The coils with LC of 5, 9 have shown lower augmentation capacity as they have insufficient surface of the coil wire element to transform the flow sufficiently into swirl and crossing the values of empty conduit. It can be concluded that coil lengths of 5, 9 cm are not suitable for the augmentation. |
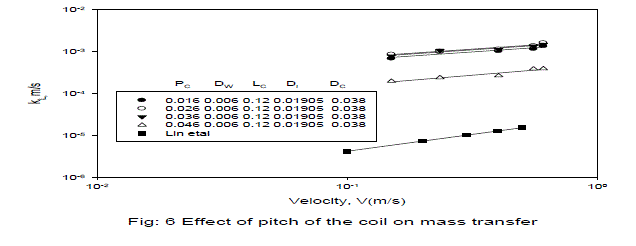
| I. Pitch of the coil: Pitch of the coil is defined as distance per cycle. Pitch of the coil is varied from 1.6 to 4.6 cm. Figure: 6 reveals, as the pitch increases mass transfer coefficient marginally increases up to pitch of 3.6 followed by a decrease. On further increase in pitch, a decrease in mass transfer was recorded. This observation was in line with many earlier workers (1, 2, 3, and 4). But the pitch that records maximum mass transfer coefficient is different for different studies. In the present study the pitch 3.6 cm was recorded as maximum augmenting one, hence it is recommended for obtaining maximum augmentation. |
 |
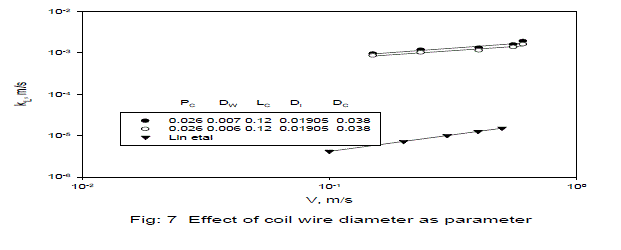
| J. Effect of Coil Wire Diameter: The coil wire diameter has sufficient influence on mass transfer coefficient. Figure: 7 reveal that mass transfer coefficient is increasing with increase in diameter of the coil wire. It may attributed that larger the coil wire diameter has greater surface area. The surface area of the coil drags the fluid element and transforms the axial flow to the swirl. But some amount of energy is consumed as the coil retards the momentum of the fluid. |
 |
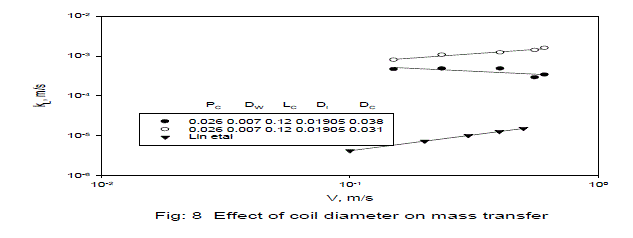
| K. Effect of Diameter of the Coil: Coil diameter has strong influence on mass transfer coefficient. To know the effect of coil diameter, a graph is drawn shown as figure: 8. Coil diameters were varied as 3.1cm, 3.8cm. The coil which is in the middle of the cross section has greater augmentative capacity as it encounters fluid elements of higher velocities there by transformation of axial flow to swirl flow is greater. The coil that is placed near the wall encounters low velocity fluid that was caused by the formation of boundary layer. The fluid elements away from the wall, i.e near to centre have greater influence. Lesser coils provide greater augmentation at higher superficial velocity. |
 |
| L. Augmentation Capacity: Augmentation capacity of the promoter can be judged by the augmentation factor defined as kL/kL0. A graph is drawn as augmentation factor versus Reynolds number for two sets of data which were nearly minimum and maximum respectively and shown as figure: 9. The maximum augmenting set exhibited a minimum near the Reynolds number of 14000 followed by an increase. The minimum augmenting one is nearly uniform with marginal augmentations. A careful selection of promoter would yield optimum conditions for the operation. |
 |
| M. Energy enhancements over the data of smooth pipe flow The energy requirement for unit area of the cell is calculated by the following equation. The energy loss in the case of pipe without any insert in them is indicated by E0. The energy factor is defined as E/E0. A graph is drawn as energy factor versus Reynolds number and presented as figure: 10. These figures reveal energy factors are decreasing with Reynolds number. |
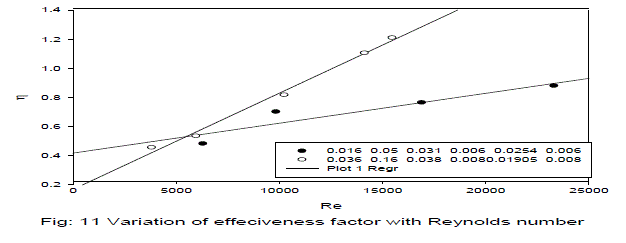
| N. Performance of the entry region coil promoter Performance factor () is the ratio of augmentation factor to energy factor and defined by the following equation. |
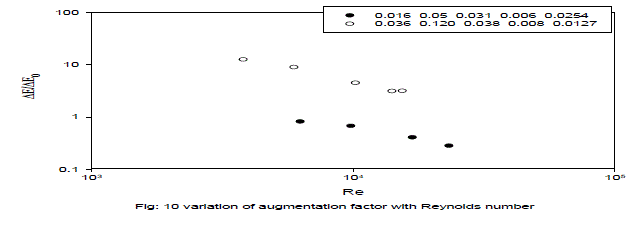 |
| A graph is drawn energy factor with Reynolds number for two different sets with coils of varying geometric configuration as shown in inset and shown as figure. 10. The figure reveals the energy factor is decreasing with Reynolds number. Further increase in Reynolds number would remain constant which is could be seen when range flow rate increased further. The efficiency is a measure for efficiency of the promoter. Efficiency of the promoters under study could be judged from graphs of versus Reynolds number. A graph is drawn as performance factor versus Reynolds number and shown as figure: 11. The Performance is increasing linearly with Re. The promoter producing maximum turbulence is augmenting better and the efficiencies are increasing steeply indicating higher augmentation at lower flow rates. |
 |
IV. DEVELOPMENT OF CORRELATIONS FOR MASS TRANSFER |
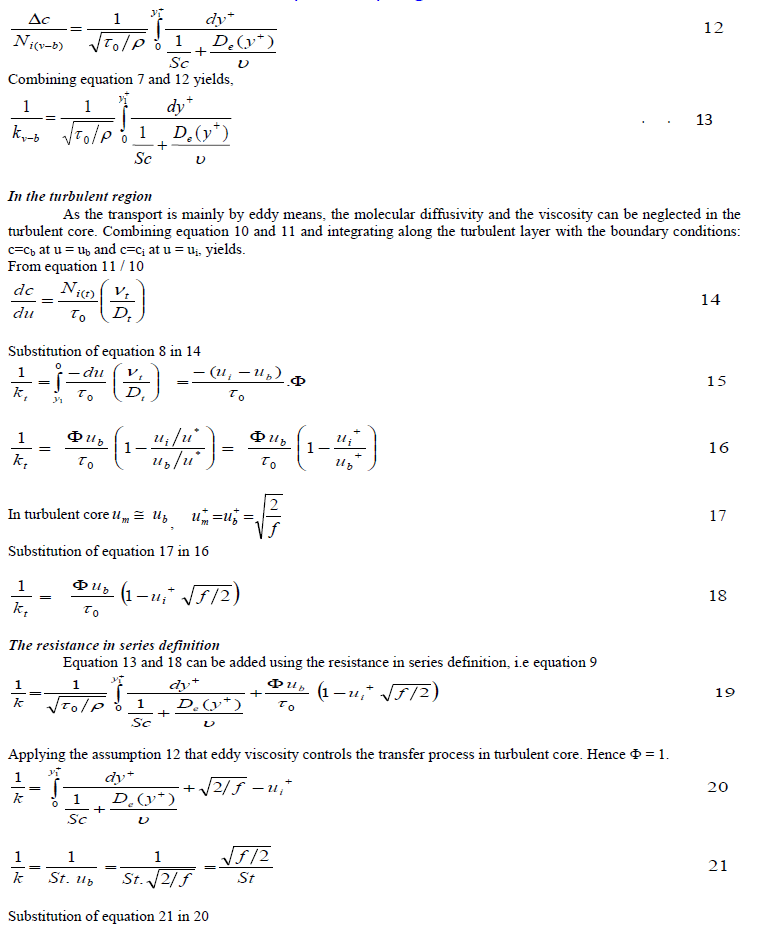
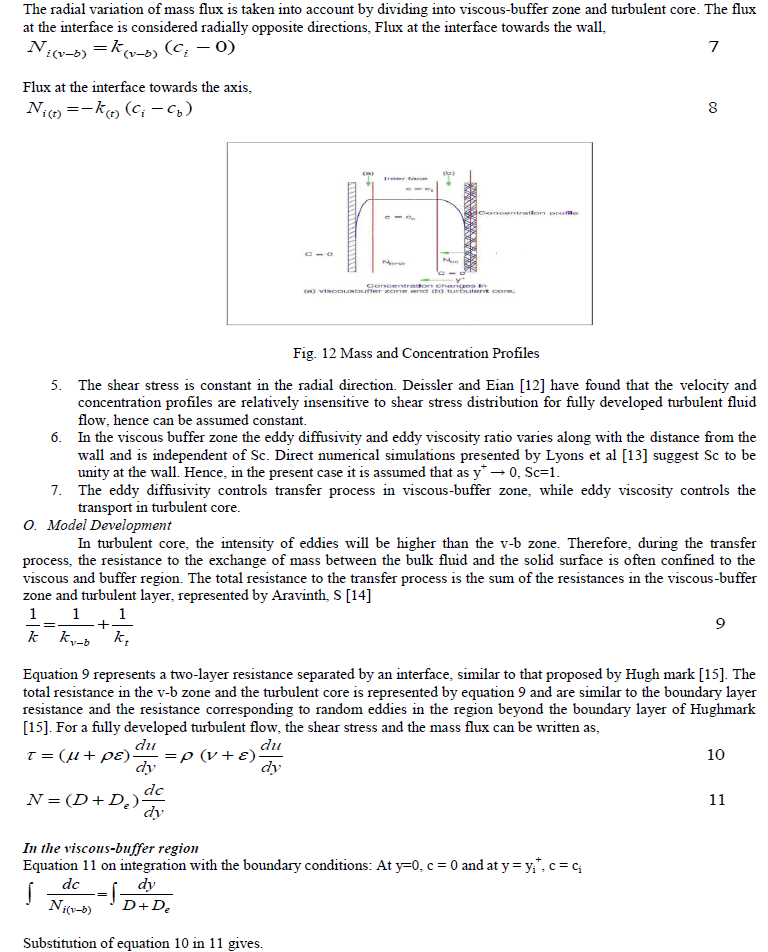
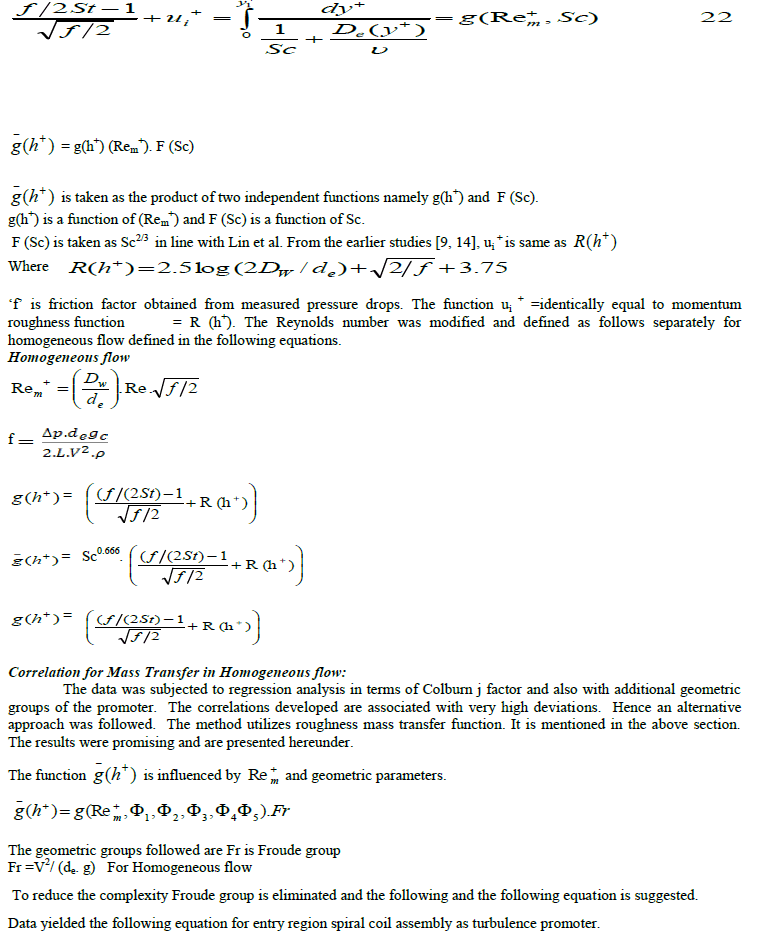
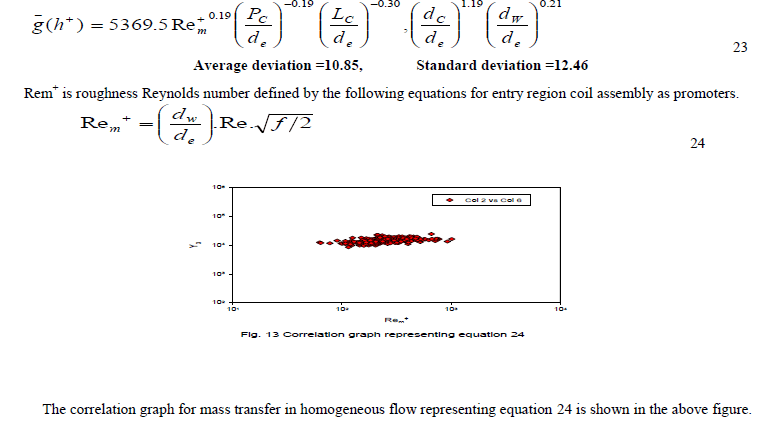
| Flow of electrolyte through circular conduit with entry region coil as insert promoters will establish mass and concentration profiles and was shown in figure: 12. The profile is divided into two regions, the inner region and outer region. The inner region again divided into laminar sub layer and viscous buffer zone. The outer region is turbulent core region and is fully turbulent. The turbulent core separated by an interface. A model is developed with the following assumptions: 1. The fluid is Newtonian, incompressible, and has constant transport Properties that is independent of time. 2. The turbulent flow through smooth tube is fully developed with no entrance effects. The effect of body forces is small in comparison to that of viscous and inertial forces. 3. The axial velocity profile is independent of axial coordinate, similarly the concentration gradients. 4. The mass flux varies in the radial direction. The mass flux varies linearly with y, and is represented by the equation. |
 |
 |
 |
 |
V. CONCLUSIONS |
Homogeneous flow: |
Mass Transfer: |
| 1. The limiting current value are found to fluctuating little extent with distance indicating oscillatory behavior, but the oscillation tendency is dampened with the length of the test section. 2. The mass transfer coefficient is increasing with the length of the coil. As the pitch increases mass transfer coefficient marginally increases up to pitch of 3.6 followed by a decrease. 3. Mass transfer coefficient is increasing with increase in diameter of the coil wire. Larger coils provide greater augmentation at higher superficial velocity. The augmentations are decreasing to a minimum followed an increase in Reynolds for most of the coils under study |
 |
 |
| p = based on particle diameter |
| t = total of molecular and eddy |
| v = viscous, V-b = viscous buffer region |
References |
|