ISSN ONLINE(2278-8875) PRINT (2320-3765)
ISSN ONLINE(2278-8875) PRINT (2320-3765)
Yashasvi Jaiswal1, Somesh Kumar Dewangan2
|
| Related article at Pubmed, Scholar Google |
Visit for more related articles at International Journal of Advanced Research in Electrical, Electronics and Instrumentation Engineering
Biometrics is the science of establishing the individual’s identity based on its physical and behavioral features. Many features can be used as a biometric trait like, fingerprint, gait, hand, palm, iris, face, signature and so on, but With the cost of eye-scanning technology coming down and the need for more secure systems going up, it’s time to take a close look at iris recognition. The iris of every individual is unique and remains unchanged with time. The study of effect of alcohol on the iris is a challenging task. The pupil of the eyes gives noticeable change in the presence of alcohol. There were very few literatures found in this field, though many researches had been done over iris recognition but the study over alcoholic eyes is limited to few numbers. The present work deals with the study of psychometric features of iris as a screening instrument for determining the presence of alcohol. this paper uses the textural features of an eye image for analysis of alcoholic eyes and it is found that textural features gives appropriate results. The algorithm used is the textural based property algorithm. The output of the work will give the differentiation between an alcoholic and non- alcoholic subject and thus protecting a secure organization from various threats.
Keywords |
| Iris recognition, biometric, eye scanning, biometric trait. |
INTRODUCTION |
| Among various biometric modalities, iris, arguably, is one of the most reliable, universal, measurable, accurate and inimitable. Many different aspects of human physiology, chemistry or behavior can be used for biometric authentication. The selection of a particular biometric trait for use in a specific application involves a weighting of several factors. Seven such factors are there that can be used when assessing the suitability of any trait for use in biometric authentication. Universality, Uniqueness, Permanence, Measurability, Performance Acceptability, Circumvention. In the present work IRIS is being used for the study and analysis of alcoholic eyes.In 1985, iris recognition was first proposed by Flom and Safir. In 1993, Daugman proposed an iris recognition algorithm representing iris image as a mathematical function. After that Wildes, Boles, Ma, and several other researchers proposed different recognition algorithms. Although other research exists in the iris recognition field, the work done by John Daugman is prominent in that it has produced commercial products and applications that implement iris recognition technology. In 1993, John Daugman wrote his original scientific paper called “High confidence visual recognition of persons by a test of statistical independence.” This is published in IEEE Transactions on Pattern Analysis and Machine Intelligence, vol. 15(11), pp.1148-11 61.He developed a computerized process to generate a binary encoded template called an Iris code from a camera image taken of an iris. His algorithms are then used to compare Iris codes for identity verification. Daugman maintains a web site at http://www.cl.cam.ac.uk/jgd1000 that includes reference papers that describe his algorithms and iris recognition technology. Many researches had been done for iris recognition and number of algorithms has also been developed for it, but o the best of our knowledge, there has not been any study that has carefully evaluated iris recognition performance under alcohol influence. So this paper focuses on this issue. The images of the eye is being captured by a digital camera and then a textural based property algorithm is applied for further analysis. The further paragraphs of the paper give the detailed explanation of the actual problem, and the process of its solution with results. IRIS is the most appropriate feature as it gives the best results. Using other features the probability of false reject (type I), and false accept (Type II) error graphically ranges from 0 to 10 percent but while using iris it ranges from 0 to 0.09 percent. |
II. IRIS RECOGNITION |
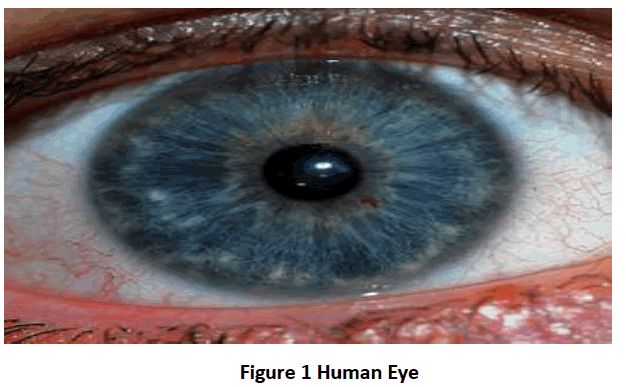
| The iris is a thin, circular structure in the eye, responsible for controlling the diameter and size of the pupils and thus the amount of light reaching the retina. "Eye color" is the color of the iris, which in humans can be green, blue, brown, and in rare cases, hazel (a combination of light brown, green and gold), grey, violet, or even pink. In response to the amount of light entering the eye, muscles attached to the iris expand or contract the aperture at the center of the iris, known as the pupil. |
 |
| In the above figure the central transparent area shown as black is the Pupil, and the blue area surrounding it is the IRIS. The other structures visible are the white sclera surrounding the iris. |
| The present work involves first capturing the image of a subject by using a digital camera and then pre processing it thus converting it to filtered sharp gray scale image which is being stored. The image of IRIS of the same person in two conditions, first in alcohol presence and next in absence is taken by a digital camera and is stored in separate databases for comparison. Once the comparison is successful the person is proved authentic and is accepted. The imageJ tool, which is an open source tool of Java is then used for analyzing the textural features. The process involves the following steps: |
(1) Imaging |
| First, an image must be captured by a digital camera in controlled conditions, at same temperature, light, distance and other physical factors. |
(2) Pre processing |
| The image captured is then pre processed by a special filter called homo morphic butter worth filter, which removes all the noise from the image, making it sharp and also converted to the gray scale. This image is assumed o be free from all red and white spots, or any other damage. |
(3) Recognition |
| In order to verify that a person is with alcohol or without, the image is being taken as input and then a tool named imageJ tool of java is being applied over it. This tool gives the value of all the textural features of the image. This process is repeated for two times, one for the pre image of the subject(without alcohol) and second for the post image (with alcohol) of the same subject. The differences are being noted and the subject is differentiated. |
III. PROBLEM FORMULATION |
| Collecting a database that contains iris images captured before and after alcohol consumption is a challenging task. To the best of our knowledge, there is no public database that contains such variations for multiple subjects. In this research, the first contribution is collecting the images of the eye of a person in normal condition that is without having alcohol and storing it in the database and than taking the image of eye of that same person in the presence of alcohol and again store it in the database. Iris images were captured using the digital camera under semi-controlled environment. A total of 10 subjects volunteered (age group of 24-27 years) and two images of both the eyes were captured before and after alcohol consumption. The subjects consumed about 150 ml of alcohol (with 42% concentration level) in approximately 15 minutes and the images were captured 15-20 minutes after alcohol consumption. In this process, room temperature, lighting and other factors were kept constant so that the only varying parameter was alcohol consumption. The database contains 16 pre alcohol and 16 post alcohol images obtained from 8 subjects. Assuming that all the images are the pre processed image with following properties: |
| 1. The image enhancement has been done. That says the input image is already enhanced that is pre processed. |
| 2. White light removal has been done. The image which has been taken is assumed to be free of any kind of white spot that comes in some cases of camera image. |
| 3. The images taken are assumed to be sharp and free from all damage. Also it is assumed that the image has no red eye defect at any part of the eye. |
| 4. It is assumed that no red point, white point or any other defect is not present in the input image. |
IV. SOLUTION METHODOLOGY |
ImageJ tool- |
| ImageJ is a public domain Java image processing and analysis program inspired by NIH Image for the Macintosh. It runs, either as an online applet or as a downloadable application, on any computer with Java 1.5 or later virtual machines. |
| It can calculate area and pixel values statistics of user defined selections. Also it can measure distance and angle. It supports standard image processing functions such as contrast manipulations, sharpening, smoothening, edge detection and median filtering. Image J can be downloaded from http://imagej.nih.gov/ij/download.html After installing the imageJ tool when we open it, the following window is opened: |
 |
| From the above figure2 , we can observe the number of selections are present, like rectangular, elliptical, freehand and polygon selections. Here we select the freehand selection tool for selecting the portion of eye which is required for texture analysis.The ‘imageJ tool’, is an open source tool of Java. It is being used here for calculating the textural feature of the eye. The total of 34 parameters are being analyzed, namely, area, mean, StdDev(standard deviation), mode, Min, Max, X, Y, XM, YM, Perim. (perimeter), BX, BY, Width, Height, Major, Minor, Angle, Circ., Feret, IntDen, Median, Skew, Kurt, %Area, RawIntDen, Slice, FeretX, FeretY, FeretAngle, MinFeret, AR, Round, Solidity. |
| The value of all the textural features vary for the pre and the post images and by that, the alcoholic subject can be differentiated. |
V. EXPERIMENTAL RESULTS |
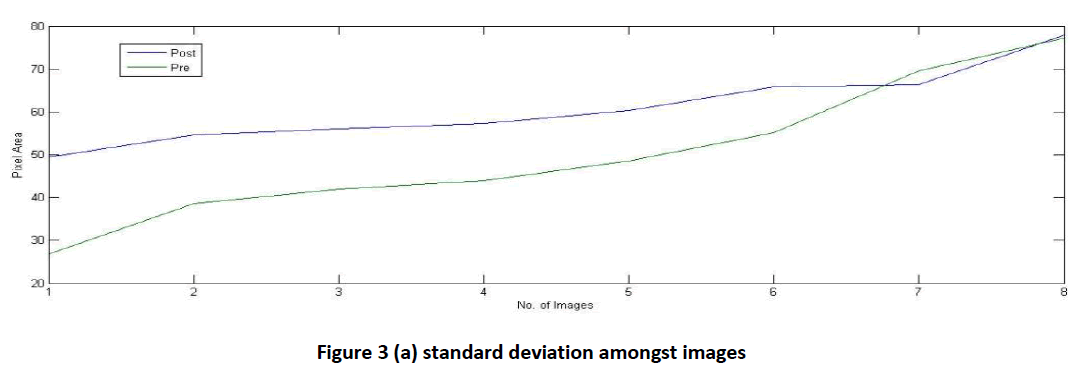
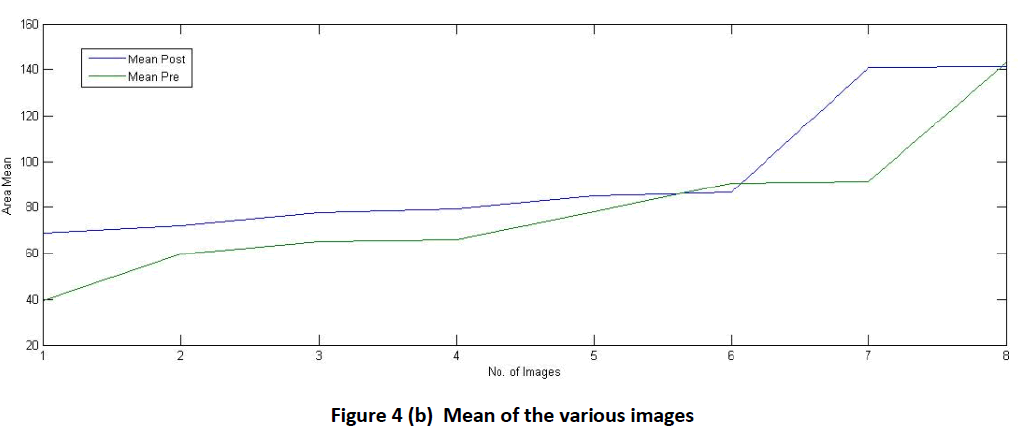
| The total of 16 images of pre and post alcoholic iris have been processed and the following results are being obtained, which has been plotted in the graphs as shown in figure 3 (a) and (b): |
 |
 |
| From the above two graphs we can see that in the graph (a), the standard deviation of the various images in both pre and post alcohol consumption effects in iris area. In graph (b), mean variation is shown . From the graph it is clearly seen that in the sixth image there is a change in both graph (a) and (b) this sudden change is due to the error given by the proposed method. |
References |
|