ISSN ONLINE(2319-8753)PRINT(2347-6710)
ISSN ONLINE(2319-8753)PRINT(2347-6710)
Sangappa K Ganiger1, Chaluvaraju B V2, Murugendrappa M V3#
|
| Related article at Pubmed, Scholar Google |
Visit for more related articles at International Journal of Innovative Research in Science, Engineering and Technology
In-situ polymerization of pyrrole (Py) was carried out with Zinc Tungstate (ceramic) in the presence of oxidizing agent ammonium persulphate to synthesize polypyrrole (PPy)/Zinc Tungstate (ZnWO4) by chemical oxidation method. The PPy/ZnWO4 composites were synthesized with various compositions viz., 10, 20, 30, 40 and 50 wt. % of ZnWO4 in Py. The surface morphologies of these composites were analysed using Scanning Electron Microscopy (SEM) show that ZnWO4 particles are embedded in PPy chain to form multiple phases. The Fourier Transform Infra-Red Spectroscopy (FTIR) reveals that stretching frequencies were shifted towards higher frequency side. The powder X-ray diffraction (XRD) spectrograph suggests that they exhibit semi-crystalline behaviour. Thermal analysis (TG/DTA) studies/testing were done and reported. The frequency dependent ÔÂ1, ÔÂ11 and tangent loss reveals that, concentration of the ZnWO4 in PPy is responsible for the variation in value of ÔÂ1 and ÔÂ11 of the composites. The dimensions of ZnWO4 particles in the matrix have a greater influence on the ÔÂ1 and ÔÂ11.
Keywords |
| Polypyrrole; Zinc Tungstate; Composites; Dielectric; Frequency. |
INTRODUCTION |
| During the last 30 years, however, conducting polymers characterized by better electrical conductivities have been found.These materials have attracted the interest of both academic and industrial researchers in fields ranging from Chemistry to Solid State Physics and Electrochemistry. The close interaction between scientists from diverse background has been major factor in the rapid development in the field of conducting polymers. The discovery of electrical conductivity in molecular charge transfer promoted the development of conducting polymers which have been synthesized and show the excellent electrical properties. Conducting polymers, by virtue of their light weight and greater ease of fabrication, have replaced and are continuing to replace metals in several areas of applications. Conducting polymers have been prepared for a wide range of applications ranging from rechargeable batteries to smart windows. |
| Polypyrrole (PPy) has become one of the most studied electronically conducting polymers. It can be synthesized either chemically or electro-chemically. Polypyrrole is an intrinsic conducting polymer which can be made to have conductivities up to 1000 S cm–1 rendering its versatile applications in batteries, electronic devices, functional electrodes, electro-chromic devices, optical switching devices, sensors and so on [1–5]. |
LITERATURE REVIEW |
| Researchers have reviewed recent research work on polypyrrole type conducting polymers. Research and development work had been reviewed with special interest in chemical, electrochemical, doping process and polypyrrole based composites processes. Process development with high accuracy of product results had the direct relationship with structure and properties. According to them, polypyrrole based on a variety of structures generated from molecular structural modification could give more interesting results for future applications. |
| Combining two kinds of materials to form composite may lead to a synergy effect and help to enhance each other, which are helpful for improving sensor properties such as thermal stability, lower operating temperature and fast response and recovery. Conducting polymer/metal oxide nano-composites have been synthesized in most recent times and based on these nano-composites gas sensors, humidity sensors and biosensors have also been developed by few research groups. However, the conducting polymer/metal oxide based sensors are still under development and new concepts are continuously tested all over the world. |
| This study presents the design and fabrication of a capacitive micro humidity sensor integrated with a fivestage ring oscillator circuit on chip using the complementary metal oxide semiconductor (CMOS) process. The area of the humidity sensor chip is about 1 mm2. The humidity sensor consists of a sensing capacitor and a sensing film. The sensing capacitor is constructed from spiral inter-digital electrodes that can enhance the sensitivity of the sensor. The sensing film of the sensor is polypyrrole, which is prepared by the chemical polymerization method, and the film has a porous structure. The sensor needs a post-CMOS process to coat the sensing film. The post-CMOS process uses a wet etching to etch the sacrificial layers, and then the polypyrrole is coated on the sensing capacitor. The sensor generates a change in capacitance when the sensing film absorbs or desorbs vapour. The ring oscillator circuit converts the capacitance variation of the sensor into the oscillation frequency output. Experimental results show that the sensitivity of the humidity sensor is about 99 kHz/%RH at 25 °C. |
EXPERIMENTAL DETAILS |
SYNTHESIS |
| The AR grade [SpectroChem Pvt. Ltd.] pyrrole [6] was purified by distillation under reduced pressure. 0.3 M pyrrole solution was contained in a beaker which was placed in an ice tray mounted on a magnetic stirrer. 0.06 M ammonium persulphate [7] solution was continuously added drop-wise with the help of a burette to the above 0.3 M pyrrole solution. The reaction was allowed for 5 hours under continuous stirring by maintaining a temperature of 0 °C to 3 °C. The precipitated polypyrrole was filtered and dried in hot air oven and subsequently in a muffle furnace at 100 °C. The yield of the polypyrrole was 3.6 g which has taken as 100 wt. %. |
| For 0.3 M pyrrole solution, 0.36 g (wt. 10%) of Zinc Tungstate(ZnWO4) was added and mixed thoroughly. Further 0.06 M ammonium persulphate was continuously added drop-wise with the help of a burette to the above solution to get PPy/ZnWO4(wt. 10%) composite. Similarly, for 20, 30, 40 and 50 wt. %, 0.72 g, 1.08 g, 1.44 g and 1.8 g of ZnWO4[Sisco Research Lab Ltd.] powder [8] is taken and the above procedure is followed to get PPy/ZnWO4 composites. The pure PPy and PPy/ZnWO4 powder was pressed in the form of pellets of 1 cm diameter using hydraulic press. The conducting silver paste was applied to the pellets of synthesized composites to act as electrodes. |
CHARACTERIZATION |
| The SEM [6-12] images of the pure PPy, PPy/ZnWO4(wt. 50%) composite and ZnWO4 were recorded using Scanning Electron Microscope (Jeol 6390LV). The FTIR [6-7, 10-12] spectra of were recorded on FTIR (Thermo Nicolet Avatar 370) spectrometer in KBr medium at room temperature. The XRD patterns were recorded on X-ray Diffractometer (Bruker AXS D8 Advance) [6-11] using Cu kïÃâõ radiation (ïÃÂì = 1.5418 Å) in the 2θ range 20°–80°. Thermal analysis studies/testing were done in the heat range from 40 °C to 740 °C at 10 °C/min for the pure PPy, PPY/ZnWO4 (wt. 50%) composite and ZnWO4 using Thermal Analysis System (TG/DTA) (Perkin Elmer Diamond TG/DTA).The frequency dependent dielectric properties of our samples in the form of cylindrical pellets (1 cm dia × 1- 3 mm thick, with silver paste electrodes) were studied at room temperature using Hioki (Japan) Model 3532-50 programmable computer interfaced digital LCR meter. Following parameters were selected for measurement through the LCR meter software: (1) Complex impedance, Z (ohm), (2) Phase angle ïÃÂä(degree)(3) Equivalent parallel capacitance, Cp(farad) and (4) Dissipation factor, D. About 50 frequencies, f (Hz), in the permissible range of 50 Hz to 5 MHz of the LCR meter were selected for measurement of each of these parameters. The sample was held in the sample holder and once the measurements were started, the LCR meter measured these selected parameters at each of the selected frequencies successively in ‘Normal mode’ which ensured higher accuracy of measurement and transferred the data to the computer. Using the measured parameters, the required parameters were calculated using the following equations, at the selected frequencies. |
RESULT AND DISCUSSION |
SEM Analysis |
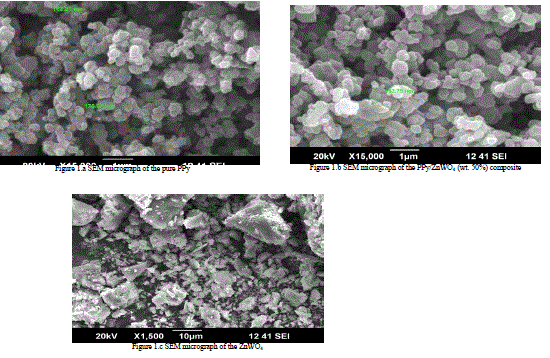 |
| Figure 1.a represents the SEM micrograph of pure PPy. The figure represents the size and spherical nature of PPy particles. The elongated chain pattern of the polypyrrole particles was observed. Two particles sizes were measured as 162.21 nm and 176.37 nm. |
 |
| Figure 1.b represents the SEM micrograph of the PPy/ZnWO4 (wt. 50%) composite. Here, particle size was increased with small change and measured as 162.75 nm. This has shown that, the ZnWO4 particles were embedded uniformly in PPy chain to form multiple phases, presumably because of weak inter-particle interactions. |
 |
| The Figure 1.c has shown the SEM micrograph of the ZnWO4. TheFigure 1.c is represent,the SEM micrograph of ZnWO4shown semi crystalline nature [6-12]. |
 |
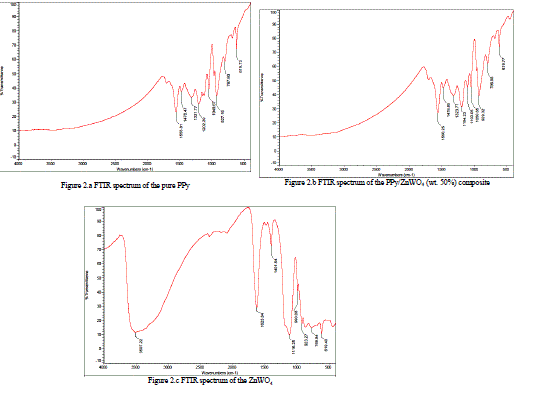
| The Figure 2.a has shown the FTIR spectra of pure PPy. Characteristic frequencies were observed at 1555 cm- 1, 1476 cm-1, 1321 cm-1, 1202 cm-1, 1049 cm-1, 927 cm-1, 797 cm-1 619 cm-1 for pure PPy. |
 |
| The Figure 2.b has shown the FTIR spectra of, PPy/ZnWO4 (wt. 50%) composite. Characteristic frequencies were observed at 1567 cm-1, 1480 cm-1, 1328 cm-1, 1198 cm-1, 1109 cm-1, 1052 cm-1, 931 cm-1, 801 cm-1& 619 cm-1 for PPy/ ZnWO4 (wt. 50%) composite.may be attributed due to the presence of C=N stretching, N–H bending deformation, C–N stretching and C–H bending deformation frequencies. The stretching frequencies were shifted towards higher frequency side when pure PPy was compared with PPy/ZnWO4 (wt. 50%) composite. This indicates that, there is homogeneous distribution of ZnWO4 particles in the polymeric chain due to the Van der Walls interaction between polypyrrole chain and ZnWO4 [6-7, 10-14]. |
 |
| The Figure2.c has shown the FTIR spectra of ZnWO4.Characteristic frequencies were observed at 1518 cm-1, 1360 cm-1, 1049 cm-1, 963 cm-1, 911 cm-1, 842 cm-1& 615 cm-1 for ZnWO4.This shown that, there is homogeneous distribution of ZnWO4 particles in the polymeric chain. So, particles of ZnWO4in pure PPy have shown that,ZnWO4 particles have strong influence on pure PPy. |
 |
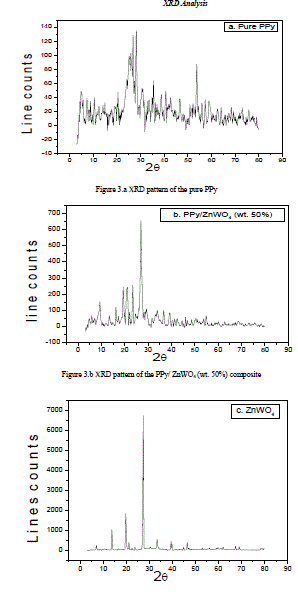
| The Figure 3.a represents the XRD pattern of pure PPy. This has a broad peak at about 2θ=25°, shown a characteristic peak of amorphous PPy. |
 |
| The XRD pattern of PPy/ZnWO4 (50 wt. %) composite shown in the Figure 3.b. The characteristic peaks were indexed by lattice parameter values. The main peaks were observed with 2θ at 9.31°, 13.32°, 16.19°, 19.32°, 21.12°, 23.39°, 26.89°, 31.66°, 36.63°, 39.24°, 41.32°, 46.06°, and 54.85° with respect to inter-planar spacing (d) 9.48 Å, 6.64 Å, 5.46 Å, 4.59 Å, 4.20 Å, 3.79 Å, 3.31 Å, 2.82 Å, 2.45 Å, 2.29 Å, 2.18 Å, 1.96 Å, and 1.67 Å respectively. Careful analysis of the XRD of the PPy/ZnWO4 (50 wt. %) composite suggests that, it exhibits semi-crystalline behaviour. |
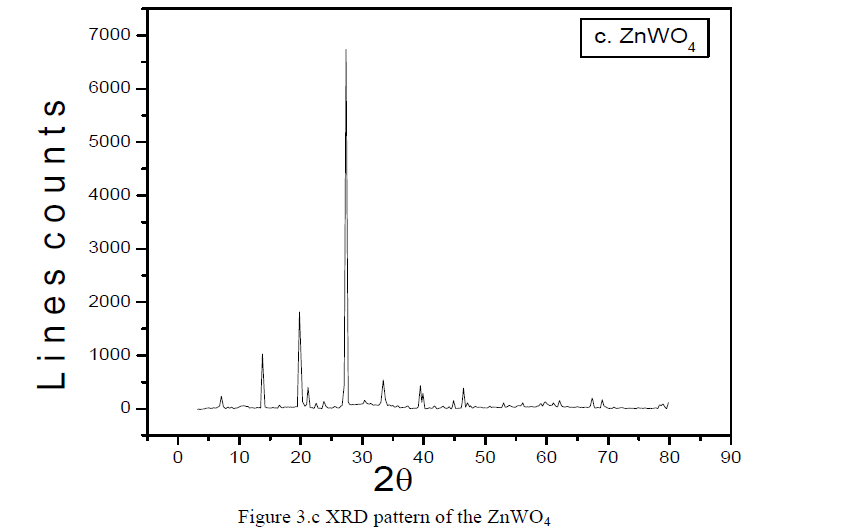 |
| Figure 3.c XRD pattern of the ZnWO4.The Figure 3.c represents the XRD pattern of the ZnWO4 revealing the semi-crystalline nature [6-11]. |
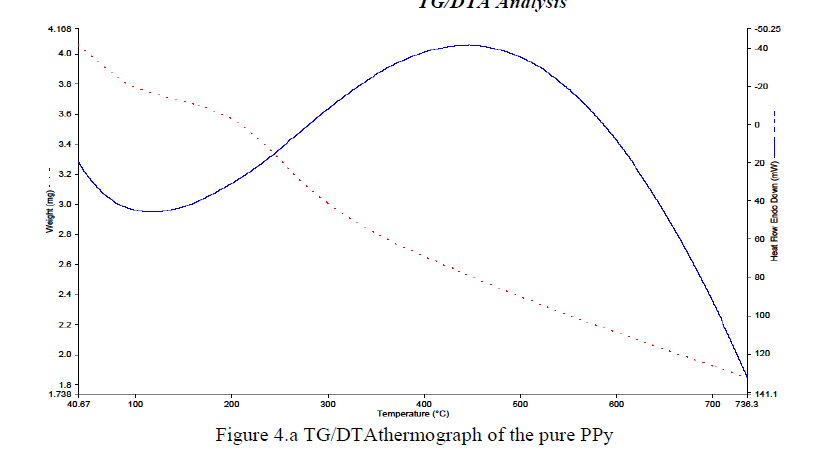 |
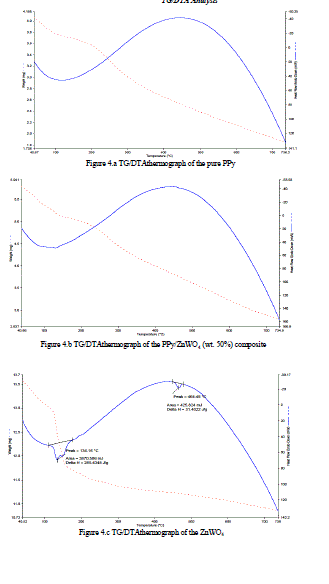
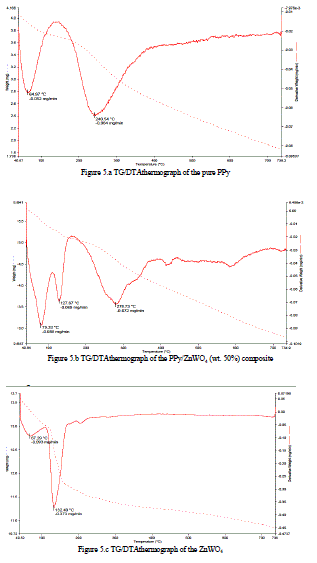
| The most important and reliable factor in the study of heat stable polymers is the measurement or evaluation of thermal stability. Thermal properties and interaction between the polymers can also be noted from the oxidative degradation curves through thermo-gravimetric analysis (TG/DTA) studies. DTA is most commonly used to determine transition temperatures such as glass transitions, melting cross-linking reactions and decomposition. However, it measures only the total heat flow and the sum of all thermal transitions in the sample.The representative TG/DTA curve for pure PPy is shown in Figures 4.a. The materials have been heated from 40 °C to 740 °C under a constant heating rate of 10 °C/min and in the inert atmosphere of nitrogen gas. Variation of weight is almost linear and the maximum polymer decomposition temperature is there from 40 °C to 740 °C for all. In the Figure 4.a, two major weight loss stages for PPy were observed at 110 °C to 130°Cand 736.3°C. |
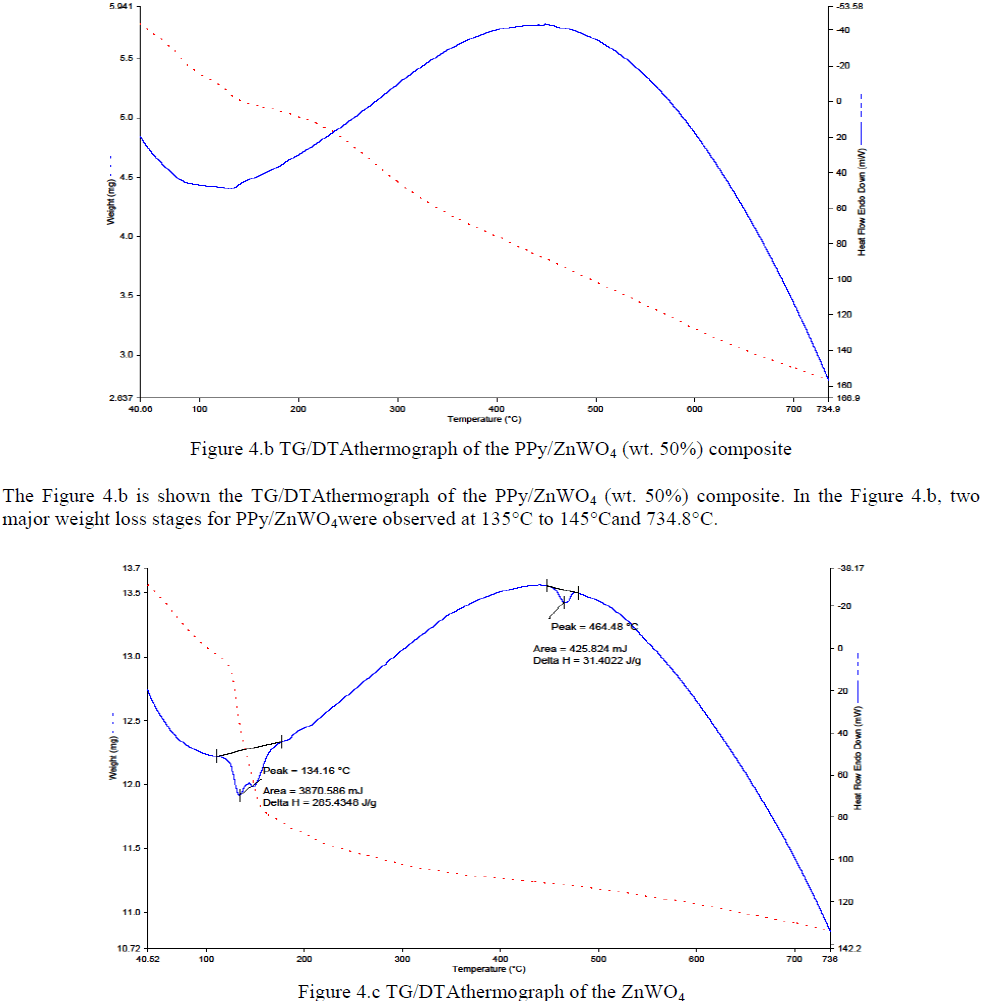 |
| The Figure 4.c is shown theTG/DTAthermograph of the ZnWO4. And in the Figure 4.c, three major weight loss stages for PPy/ ZnWO4 were observed at 130°C to 134.16°C, 464.48 °C and 734.5 °C. |
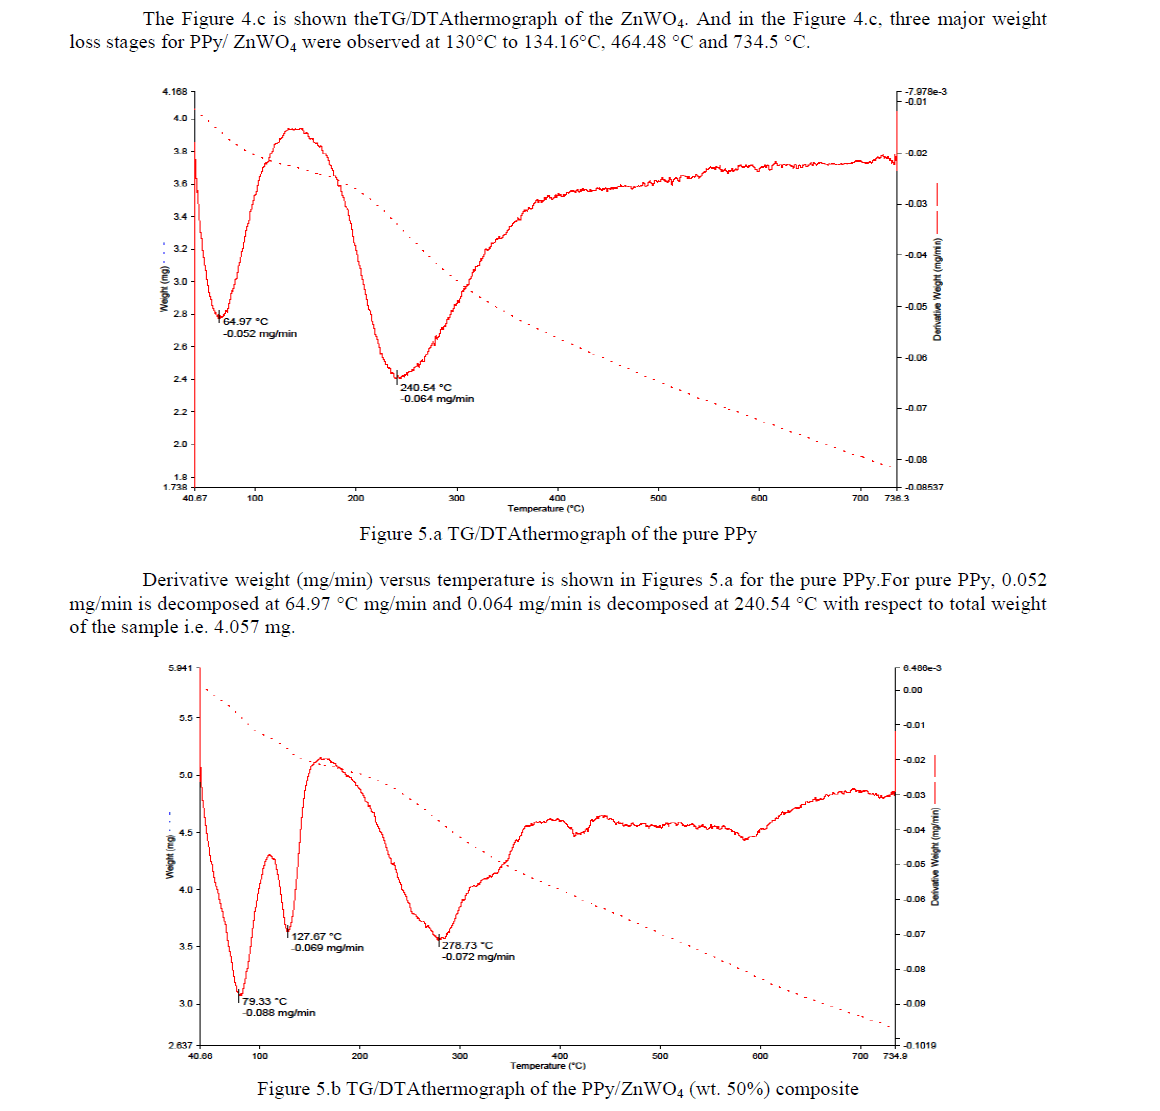 |
| Derivative weight (mg/min) versus temperature is shown in Figures 5.b for the PPy/ZnWO4 (wt. 50%) composite.For PPy/ZnWO4 (wt. 50%) composite, 0.088 mg/minis decomposed at 79.33 °C mg/min, 0.069 mg/min is decomposed at 127.67 °C mg/min and 0.072 mg/min is decomposed at 278.73 °C with respect to total weight of the sample i.e. 5.791 mg. |
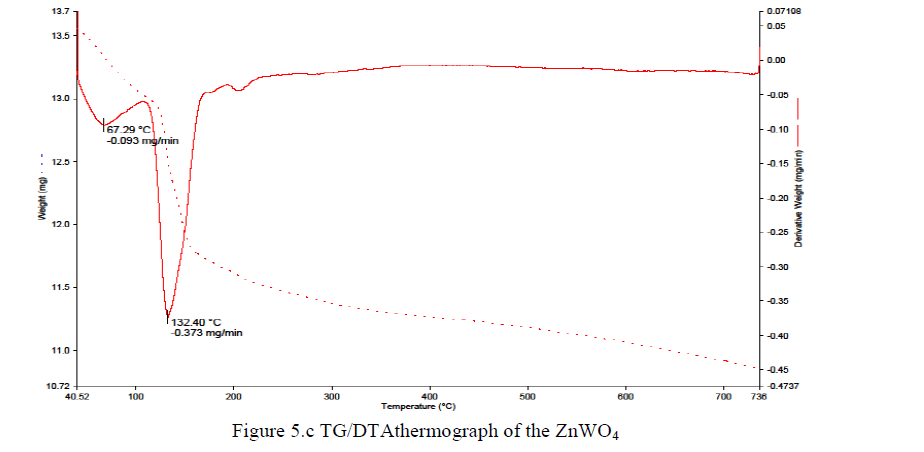 |
| Derivative weight (mg/min) versus temperature is shown in Figures 5.c for ZnWO4.For ZnWO4, 0.093 mg/min is decomposed at 67.29 °C mg/min and 0.373 mg/min is decomposed at 132.40 °C with respect to total weight of the sample i.e. 13.56 mg. |
| It is found that, the weight loss caused by the volatilization of the small molecules in PPy/ZnWO4 (wt. 50%) composite at different temperatures is slow compared to that of pure PPy and indicates its higher stability, which clearly proves that ZnWO4 was inserted into the PPy to form composite and has increased the thermal stability of the composite material [15-23]. |
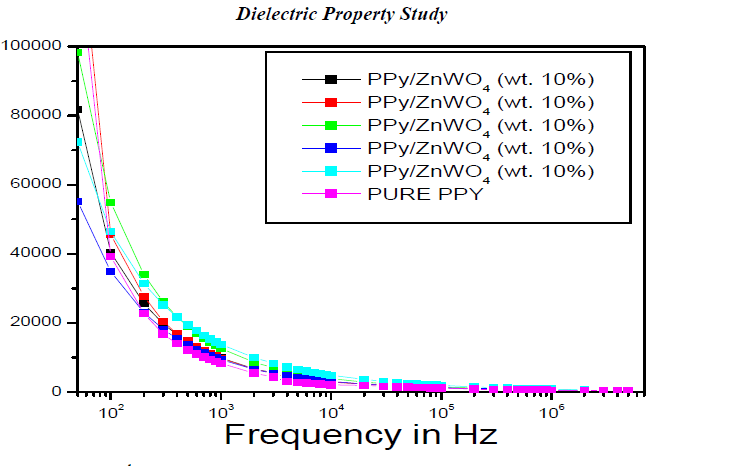 |
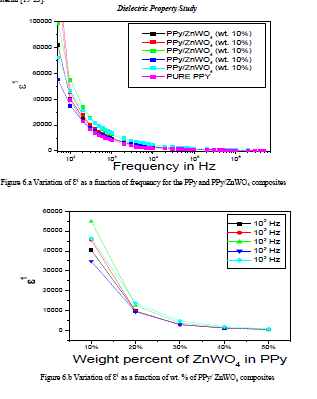
| Figure 6.a Variation of ÃâÃÂ1 as a function of frequency for the PPy and PPy/ZnWO4 composites |
| The Figure 6.a has shown the variation of ÃâÃÂ1 is a function of frequency for the PPy and PPy/ZnWO4 composites.The variation of the dielectric relative permittivity (ÃâÃÂ1) as a function of frequencyfor the pure PPy and PPy/ZnWO4 composites decreases with the increasing of frequency. |
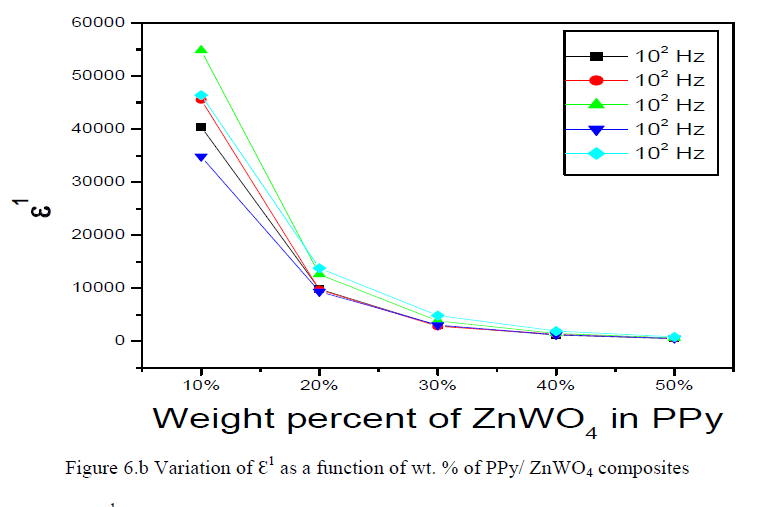 |
| The variation of ÃâÃÂ1 is a function of wt. % of PPy/ZnWO4 composites is shown in the Figures 6.b.The variation of the dielectric relative permittivity (ÃâÃÂ1) is a function of wt. % of PPy/ZnWO4 composites decreases with the increasing of frequency. |
| This may be attributed to the tendency of dipoles in polymeric samples to orient themselves in the direction of the applied field. However, the decreasing trend seems not too sharp as compared for lower frequency region at the high frequency range (104 Hz to 106 Hz). This trend is observed for all graphs for different concentration of dopants. It could be explained by dipoles orientation, which difficult to rotate at high frequency range. On the other hand, the high value of ÃâÃÂ1 at low frequency might be due to the electrode effect and interfacial effect of the sample [24-26]. |
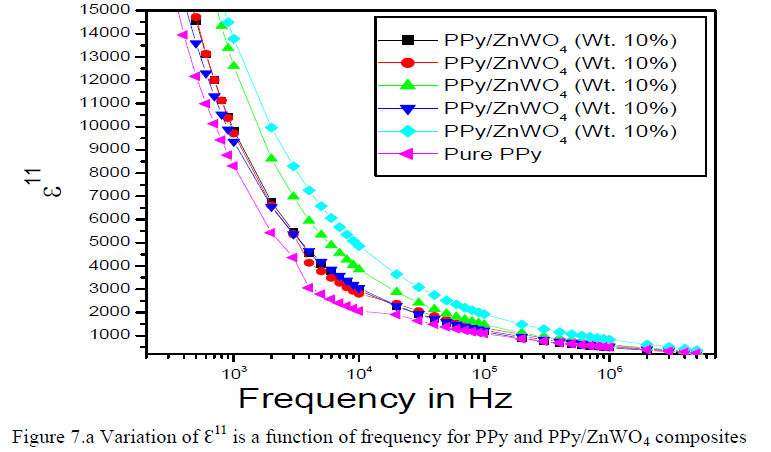 |
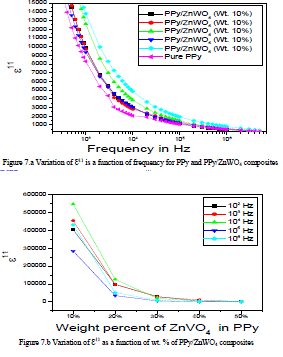
| The variation of dielectric loss (ÃâÃÂ11) is a function of frequency for the PPy and PPy/ZnWO4 composites shown in the Figure 7.a. It is clear from the graph that, the dielectric loss decreases with frequency. The larger value of loss factor or dielectric loss at low frequency could be due to the mobile charges within the polymer backbone. The higher value of the dielectric loss for the higher concentration of dopant can be understood in terms of electrical conductivity, which is associated with the dielectric loss. |
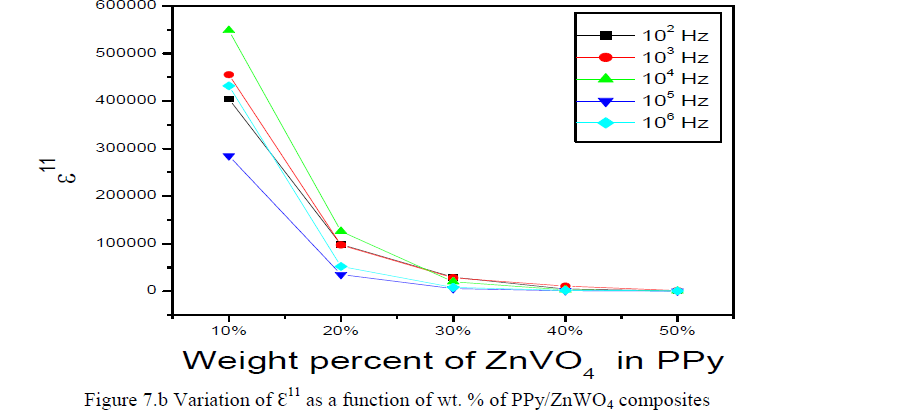 |
| The variation of dielectric loss (ÃâÃÂ11) is a function of wt. % of PPy/ZnWO4 composites for the PPy and PPy/ZnWO4 composites decreases with the increasing of frequency were shown in the Figure 7.b. On the other hand, the mobile charges i.e. polarons that belong to conducting PPy and free ions that come from ammonium persulphate increase at higher concentration of the dopant thus also influence lower value of ÃâÃÂ11 at high frequency. Moreover, the ZnWO4 exhibits flexible polar side groups with polar bond as the bond rotating having intense dielectric α-transition. Thus, there is a change in the chemical composition of the polymer repeated unit due to the formation of hydrogen bonds with hydroxyl groups in the polymerization process, which in turn makes the polymer chain flexible and hence, enhances the electrical conductivity [25-27]. |
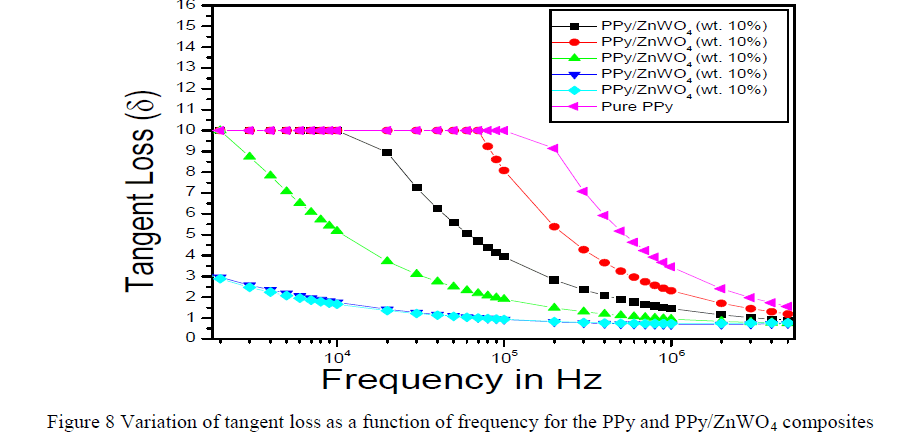 |
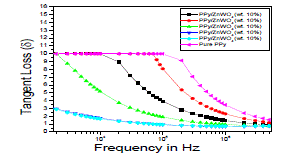
| The Figure 8 is shown the variation of tangent loss as a function of frequency for the PPy and PPy/ZnWO4 composites. One can conclude that with the increasing amount of the dopant, the tangent loss (δ) is relatively reduced although it does not change for the whole samples as it is might be due to intrinsic behaviour of the sample. These results confirm the explanation for the dielectric relative permittivity (ÃâÃÂ1) and dielectric loss (ÃâÃÂ11) characteristics as tangent loss (δ) decreases with the increasing composition of the dopant [20, 24-28]. |
CONCLUSION |
| The PPy/ZnWO4 composites were synthesized to tailor the transport properties. Detailed characterizations of the composites were carried out using SEM, FTIR, XRD and TG/DTA techniques. The results of dielectric relative permittivity (ÃâÃÂ1) and dielectric loss (ÃâÃÂ11) of PPy/ZnWO4 composites show a strong dependence on the weight percent of ZnWO4 in polypyrrole. PPy/ZnWO4 composites may find applications in sensors. |
ACKNOWLEDGEMENT |
| The authors would like to acknowledge The Principal, BMSCE, BMSET, Bangalore-560019 for their cooperation and help. FTIR, TGA, SEM and XRD analysis of the samples were carried out at Sophisticated Analytical Instruments Facility (SAIF) of Cochin University of Science And Technology, Cochin, India. The author1 thank to wife and children for cooperation. |
References |
|