Research & Reviews: Journal of Pure and Applied Physics
ISSN: 2320-2459
ISSN: 2320-2459
Zhiqian Zhang1, Lei Liu2, Lin Quan3, Guohong Shen4, Rui Zhang5, Yuqi Jiang6, Yuxiong Xue7*, Xianghua Zeng1,7*
1 College of Physical Science and Technology, Yangzhou University, Yangzhou, P. R. China
2 China Institute of Atomic Energy, Beijing, China
3 Beijing Institute of Tracking and Telecommunications Technology, Beijing, China
4 National Space Science Center, Chinese Academy of Sciences, Beijing, China
5Shanghai Sast Space Technology Co. Ltd, Shanghai, China
6Yangzhou Polytechnic Institute, Yangzhou, China
7College of Electrical, Energy and Power Engineering, Yangzhou University, Yangzhou, P. R. China
Received: 19-Jan-2024, Manuscript No. JPAP-24-124963; Editor assigned: 22-Jan-2024, Pre QC No. JPAP-24-124963 (PQ); Reviewed: 05-Feb-2024, QC No. JPAP-24-124963; Revised: 12-Feb-2024, Manuscript No. JPAP-24-124963 (R) Published: 19-Feb-2024, DOI:10.4172/2320-2459.12.1.003.
Citation: Zhang Z, et al., The Application of Neural Networks in Predicting Spatial Radiation Environments. Res Rev J Pure Appl Phys. 2024;12:003.
Copyright: © 2024 Zhang Z, et al. This is an open-access article distributed under the terms of the Creative Commons Attribution License, which permits unrestricted use, distribution, and reproduction in any medium, provided the original author and source are credited.
Visit for more related articles at Research & Reviews: Journal of Pure and Applied Physics
Accurately predicting the space radiation environment is crucial for satellite in-orbit management and space science research. A comprehensive neural network model prediction process comprises data analysis, neural network model construction, and the evaluation and validation of model accuracy. Through in-depth data analysis, we can gain a more comprehensive understanding of the distribution, trends, and correlations within the data, providing robust support for selecting a model that best fits the current dataset. Rational construction of the neural network is a key step to ensure the model learns effective information on the training set while performing well on unseen data. Accuracy evaluation also aids in identifying potential overfitting or underfitting issues, guiding further adjustments and improvements to the model. In this paper, we will discuss the application of these key steps in predicting the space radiation environment.
Space radiation environment; Data analysis; Neural network; Evaluation
Data analysis
Data analysis provides crucial training and validation data for neural network models, enhancing their understanding of complex patterns. In-depth data analysis allows for the identification of features and trends, optimizing the model's design and performance. This informed data analysis not only improves the model's accuracy but also strengthens its generalization capabilities, enabling superior performance on unseen data. For instance, researchers like Z Wu, by sorting available data, identified beneficial data points, contributing to the optimization of subsequent neural network models and the improvement of predictive performance [1].
In our previous study, we analyzed data collected during satellite operations, focusing on two aspects of proton flux, flux fluctuations and spatial distribution characteristics. Our findings are as follows, Significant fluctuations are observed in proton flux data within the high-energy range (100-200 cm-2*s-1), when satellites traverse the South Atlantic Anomaly (SAA) region, proton flux undergoes dramatic fluctuations, with an abrupt increase of more than three orders of magnitude (Figure 1).

Figure 1: Proton flux data fluctuations.
As depicted in Figure 2, the majority of abnormal fluctuations in proton flux occur during the period when satellites traverse the SAA region.

Figure 2: Scatter distribution of high value in proton flux.
Construction of the neural network model
Data preprocessing: The advantages of data preprocessing include cleaning and standardizing data, enhancing the stability and accuracy of the model. By addressing outliers and missing data, data preprocessing aids in constructing a more reliable training set, reducing the model's sensitivity to noise. Furthermore, data preprocessing streamlines the model training process, expediting convergence and providing a more dependable foundation for subsequent analysis and prediction tasks.
In the data preprocessing stage, we employed a method known as moving average wavelet transform. The application of moving averages aids in smoothing the data, reducing high-frequency noise, thereby making the data trends more distinct and recognizable. This approach not only preserves the trend information of the original data but also helps in reducing abnormal fluctuations, enhancing data stability.
On the other hand, the introduction of wavelet transform further strengthens the analytical and processing capabilities of the data [2]. Wavelet transform allows for a more effective capture of local features and short-term changes in the data. This proves crucial for identifying hidden patterns, trends, or outliers within the data, contributing to improved sensitivity and adaptability of the model [3].
Experimental results demonstrate the effectiveness of this method in data preprocessing, achieving a preservation rate of over 99% for the original data information.
Application of the neural network model
We introduced the TPA-LSTM model for proton flux prediction, integrating the Temporal Pattern Attention mechanism with Long Short-Term Memory networks. The model underwent training and validation using 4,174,202 proton flux data points over a span of 12 months. The application of the TPA attention mechanism enhances focus on proton flux variations within the South Atlantic Anomaly (SAA) region.
Experimental results demonstrate the TPA-LSTM model's excellent predictive accuracy, with a logarithmic root mean square error (logRMSE) of 3.71 between predicted and actual values. Notably, when predicting values within the South Atlantic Anomaly (SAA) region, the logRMSE is 3.09 [4-6].
In Figure 3, when we focus on the 15 minimum values between the peaks in the SAA, 11 predicted minimum flux values are one order of magnitude lower than the observed minimum flux values. This suggests the potential for improvement in the model's performance in predicting minimum flux values. However, this poses challenges as the occurrence of these minimum flux values lacks any discernible spatial pattern, making model selection and training more challenging. Subsequent steps may involve further data analysis to choose appropriate models for training and prediction, enhancing the predictive performance of minimum flux values.

Figure 3: Prediction results of the TPA-LSTM model (including 16 peaks, all caused by satellite crossings through the SAA region).
Furthermore, when we examine the predictive performance of the TPA-LSTM model for other space radiation environment data, such as dose rates, we observe a decrease in effectiveness. This may be attributed to the characteristics of dose rate data, where the maximum value is 0.75 rad/s, the minimum value is 0, and the average is 8.2e-5 rad/s. The relatively small numerical range of dose rate data may result in suboptimal predictive performance for the TPA-LSTM model in this particular data context.
Evaluation metrics
we employed two evaluation metrics to assess the predictive performance of the model: logRMSE (Logarithm of Root Mean Squared Error) and logMAE (Logarithm of Mean Absolute Error). The formulas for both metrics are as follows:
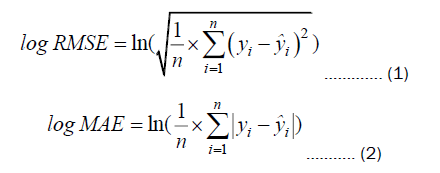
In Equations (1) and (2), n is the number of samples is the predicted value
  is the actual value.
Given the substantial differences in magnitude within the proton flux data, we opted for logRMSE and logMAE as evaluation metrics. In choosing these metrics, it's important not to rely on evaluation metrics defined in absolute flux values, such as MAE. This is because the absolute differences in data values span 3-4 orders of magnitude, implying that larger flux values with similar relative errors would result in significantly larger evaluation metrics. Therefore, the selection of logarithmic evaluation metrics helps mitigate the impact of magnitude differences in the data, ensuring that errors at larger scales do not unduly influence the evaluation metrics.
Zhiqian Zhang: Calculations and writing. Yuxiong Xue: conceptualization and methodology. Xianghua Zeng: conceptualization, methodology, writing – review & editing, and supervision. All authors read and approved the final manuscript.
This work was supported by the National Natural Science Foundation of China (61474096, 12004329), the Yangzhou Science and Technology Bureau (YZ2020263), Open Project of State Key Laboratory of Intense Pulsed Radiation Simulation and Effect (SKLIPR2115) and Foundation of National Key Laboratory of Materials Behavior and Evaluation Technology in Space Environment (WDZC-HGD-2022-11).
The datasets used and analysed during the current study are available from the corresponding author on reasonable request.
The authors declare that they have no known competing financial interests or personal relationships that could have appeared to influence the work reported in this paper.