Antoine Al-Achi*
College of Pharmacy and Health Sciences, Campbell University, P.O. Box 1090, Buies Creek, NC 27506, USA
Received date: 01/11/2018; Accepted date: 30/01/2019; Published date: 09/02/2019
Visit for more related articles at Research & Reviews: Journal of Hospital and Clinical Pharmacy
Statistical, T-test, Standard deviation, T-distribution
In statistical methods, t-test, also known as Student’s t-test, is widely used to compare groups’ means for a particular variable. The test replaces z-test whenever the standard deviation of the population (σ ) of the variable is unknown [1]. The distribution of t is bell-shape resembles that of the z distribution (also known as the Standard Normal distribution). However, its tails are heavier when compared to those of the z distribution [1,2]. Similar to the z-test, a t-test may apply to a single sample or two-sample situations. While the Standard Normal Distribution always has a mean of zero (0) and a standard deviation of one (1), the t distribution also has a mean of zero (0), however its standard deviation is greater than one (1), and it approaches the value of 1 as the degrees of freedom (d.f.) increase. (The degrees of freedom are a mathematical necessity due to the lack of information on μ .) When the sample size is extremely large (at infinity), the two distributions become identical to each other. Since information on the standard deviation of the population is lacking, the standard deviation obtained from the sample (S.D.) is used with a t-test. An Irish statistician, Mr. William Gosset, was the author of the t-distribution and he published his work earlier in the 20th century under the pseudonym “Student.” Thus the name Student’s t-test is commonly used in literature [1,2].
Student’s T-Test
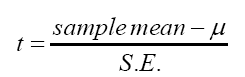
For a single-sample test, the value of t-statistics is simply the distance of a mean value that was obtained from the sample from the mean of the distribution μ in units of the standard error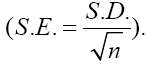
 (1)
(1)
The calculated t value is compared to the t distribution to establish statistical significance. The tails of the t distribution identify the area of rejection (i.e., rejecting the null hypothesis of no difference) and they are delineated by the tabulated t values. A confidence interval (CI) on the true mean in the population is then estimated from the single sample’s mean and two-tailed test [2-4].
CI = (sample ' smean)± t(S.E.) (2)
Similarly, for one tailed-test, the CI on CI = (sample ' smean)+ t(S.E.)may be written as
CI = (sample ' smean)+ t(S.E.) (lower-tailed) (3)
CI = (sample ' smean)− t(S.E.) (upper-tailed) (4)
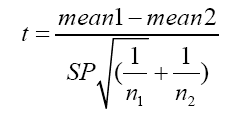
For a two-sample situation, the pooled t-test (also known as the basic t-test or unpaired t-test) may be used in the statistical calculations [2-4]. The t-statistics value is given as
 (5)
(5)
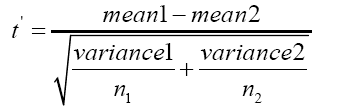
The symbol “SP” stands for the pooled standard deviation, and it is a pooled estimate of the two standard deviations of the samples since the pooled t-test assumes equal variances for the two populations where the two samples were drawn. If the populations’ variances are not homogenous and pooled t-test is used, the probability of not rejecting a false null hypothesis would increase, which is not desirable. A substitute for the pooled t-test when the variances are different is known as Behrens-Fisher’s test (also known as t’ test for two independent samples or separate t-test) [2-4]. The t-statistics for this test is:
 (6)
(6)
The variances in eqn. (6) are those of the samples. The symbols n1 and n2 refer to the number of observations in sample 1 and 2, respectively [2-4]. The confidence intervals (two-tailed) on the true difference between the means in the populations (μ1 −μ2 ) for the pooled t-test and the separate t-test are:
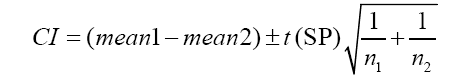 (7)
(7)
(Pooled t-test)
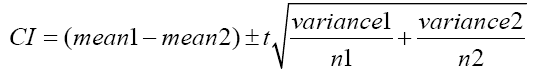 (8)
(8)
(Separate t-test)
Replace “±” by “+” or “-“ for one-tailed test lower or upper, respectively [2-4].
The third type of t-test is the paired t-test. Unlike the other two types, paired t-test concerns itself with a single sample obtained from a population. Individuals in this sample are measured twice on a variable of interest, once before “treatment” and once after receiving it. In other words, each serves as his control, and thus this method produces more precise data. In certain situations, identical twins are used where one of them is measured without “treatment,” and the other one is measure after receiving it. In this latter case, the “treatment” can be a tool such as a psychological test the individual has to take.
With paired t-test, differences between the readings “before” and “after” are computed and then for the resulting differences (di) their mean and standard deviation is obtained. The t-statistics are:
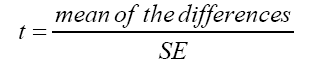 (9)
(9)
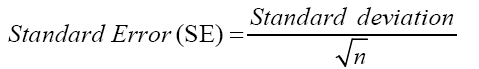 (10)
(10)
With n being the number of observations. The degrees of freedom for the test are (n −1) . A confidence interval (two-tailed) on the true mean of the differences in the population (D) is calculated from:
CI = (mean of differences ) ± t(SE) (11)
Replace “±” by “+” or “-“ for one-tailed test lower or upper, respectively. The null hypothesis is D=0 [1,4].
All types of t-test are used extensively in scientific, medical, and social investigations. Gosset’s t statistics was indeed one of the most excellent works produced during the 20th Century that contributed significantly to numerous other important discoveries. It is sensible for the scientific community to honor Mr. Gosset and name his work as the Gosset’s t-test.