ISSN ONLINE(2319-8753)PRINT(2347-6710)
ISSN ONLINE(2319-8753)PRINT(2347-6710)
V. Lakshmana Rao1, P.Satish2
|
| Related article at Pubmed, Scholar Google |
Visit for more related articles at International Journal of Innovative Research in Science, Engineering and Technology
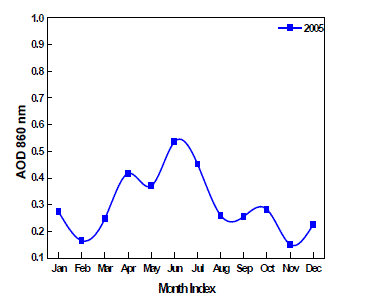
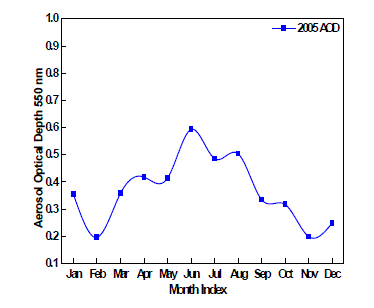
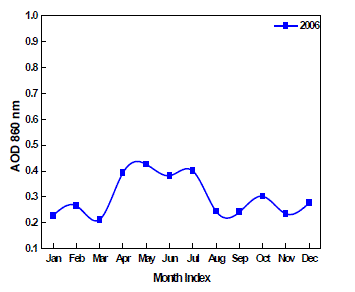
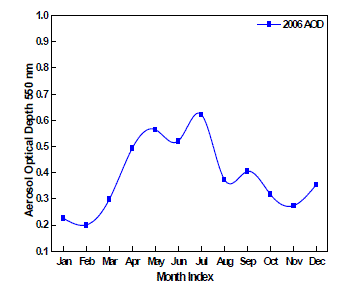
Aerosols concentration are high in VSKP and show maritime nature the So2 concentrations are relatively high in industrial and traffic junctions and low in the residential areas. The humidity oxides So2, So3 and so much to so So2 concentrations are high. Wind speed plays a very important role in dilution on built of So2 concentration. AOD is also related to particular air pollutants namely suspended particulates The Particulate pollution is high in industrial area compared to commercial and residential areas. The Iron concentration is high throughout the city because of impact of Iron ore conveyor belt. In this article the AOD of 550 nm shows a maximum in summer that is March that is followed by June. However the 860 nm AOD consistent shows a maximum in May and June period. While the AOD 550nm and 860nm are shows low concentrations in the month of February followed by November. ).We have observed for all the six years a gradual trend followed by a decrease up to winter. In the year 2005 there is no significant change, but maximum values occur in monsoon season. In all the six years the AOD values are maximum in the month of June.
Keywords |
| Aerosols, AOD, and Wind Speed. |
INTRODUCTION |
| Aerosols in the urban environment at a coastal location exhibit large variability as they consist of a variety of natural and manmade chemical compounds which are subjected to fast change in atmospheric humidity. In the troposphere, below the boundary layer, the aerosols are strongly dependent on geography and the variability of sources near the surface. Satellite measurements of aerosols, called aerosols optical thickness, are based on the fact that the particles change the way the atmosphere reflects and absorbs and infrared light. An optic thickness of less than 0.1(palest yellow) indicates a crystal clear sky with maximum visibility; where as a value of 1 (reddish brown) indicates very hazy conditions. Aerosols play an important role in cloud formation and subsequent precipitation. In the long run from climatologically point of view, the gradual increase in aerosol content leads to a change in earth atmosphere, heat balance and radiation balance leading global warming and subsequent climate change. The aerosols play crucial role not only in the formation of cloud clusters but also the subsequent precipitation, the precipitation washes down the pollutant aerosols and the aerosols concentration goes down, in that way it is cyclic process. The aerosols help in cloud formation and precipitation, where as precipitation washes down in the atmosphere, there is an optimum concentration of aerosols which will promote precipitation either less aerosols or excess of aerosols hamper the growth of clouds and the subsequent precipitation will be less or nil, thus the aerosols are important component in cloud physics and precipitation chemistry, the aerosols also absorb effectively the insulation or net radiation ,many of the urban aerosols have strong absorption bands in the infrared region, so they will allow insulation to reach surface but will strongly absorb the outgoing long wave radiation from the earth surface, so part of the radiation is trapped and re-radiated back leading to global warming. Such aerosols are known as green house aerosols. |
II. DATA AND METHODOLOGY |
| Aerosols Optical Depth(AOD) values at 550nm and 860nm derived from the Moderate Resolution Imaging Spectroradiometer (MODIS) sensor on board NASA’s Terra and Aqua Satellites for the 6 years period of 2005- 2010 have been analyzed in the present study. In this article we draw the graphs between monthly index and AOD values.These values are compared with air pollutants. The sea is the most important naturally occurring solution. Strong winds can create waves and tear spray from their crests. The droplets formed in this way are quite large and tend to fall back in to the water. |
III. RESULTS AND DISCUSSIONS |
| The aerosols optical depth has been studied for the twelve months of the year starting from 2005 to 2010 ( 6 years).We have observed for all the six years a gradual trend followed by a decrease up to winter. In the year 2005 there is no significant change, but maximum values occur in monsoon season. In the year 2006 the AOD values are more at 550 nm when compare to 860nm.However in the year 2008 there is a pronounced increased in June follow by a drastic fall. However the year 2010 is peculiar the AOD is maximum in the month of March. The summer AOD is less than the March one. It is interesting to note that AOD of 550 nm shows a maximum in summer that is March that is followed by June. However the 860 nm AOD consistent shows a maximum in May and June period.AOD is also related to particular air pollutants namely suspended particulates. The monsoon activity reduces is particulates pollutants because of washout of pollutants because of rain and there is a lot of turbulent in summer months which makes their concentration is high. Whereas the low turbulent needs to the aerosol and SPM concentrations are less. Aerosol concentrations are high in Visakhapatnam and show maritime nature the SO2 concentrations are relatively high in industrial and traffic junctions and low in the residential areas. |
IV. CONCLUSIONS |
| The aerosols spectral optical depths at Visakhapatnam show a seasonal dependence with summer maximum and winter minimum . Aerosol optical depths and their wave length dependence are strongly influenced by air mass sours. In a coastal environment, mesoscale processes such as a land/ sea breezes play an important role in determining the air mass characteristics. During summer nights which are quite hot and the aerosols well mixed, meaning little diurnal variation is observed during the summer months. Mixed layer contribution to column AOD has below 34% during summer, while it reaches almost 100% in winter. |
 |
 |
 |
 |
References |
|