ISSN ONLINE(2319-8753)PRINT(2347-6710)
ISSN ONLINE(2319-8753)PRINT(2347-6710)
| BadalH.Elias Faculty of Science, School of Physics, Duhok University,Duhok, Iraq |
| Related article at Pubmed, Scholar Google |
Visit for more related articles at International Journal of Innovative Research in Science, Engineering and Technology
A theoretical study of structural, electronic, elastic and optical properties of zinc-blende BeS under hydrostatic pressure is presented using ab-initio plane wave pseudopotential density functional theory method within the local density approximation (LDA) and generalized gradient approximation (GGA) .The dependencies of the elastic constants, the bulk modulus, young modulus and energy gaps on the applied pressure are presented, and the results are in good agreement with comparable experimental and theoretical values. Also the energy band structure and density of states under high pressure have been analysed. Furthermore, the optical constant, including the dielectric function, optical reflectivity, refractive index, optical conductivity and electron energy loss, are discussed for radiation up to 50 e V.
Keywords |
| BeS, Electronic structure, Optical properties, First principles calculations, Elastic properties, Zinc-blende structure. |
INTRODUCTION |
| Recently, it has become possible to compute with a great accuracy an important number of electronic and structural properties of solids from first-principles calculations. This kind of development in computer simulations has opened up many of interesting and existing possibilities in condensed matter studies. For example, it is now possible to explain and to predict properties of solids which were previously inaccessible to experiments .The II–VI semiconductors compounds have been extensively studied in recent years because of their scientific and technology interests.They are used in the fabrication of light-emitting devices that are employed in optical processing, detection systems for environmental pollution andcolor-displaying modules. In particular, the beryllium chalcogenidesBeS, BeSe and BeTe are the II–VI compounds that crystallize in the fourfoldcoordinated zinc-blende (B3) structure at low pressure. These BeX (X = S, Se and Te) compounds have structure and binding similar to those of the III-P group of semiconductors. They have large band gaps (2.7–5.5 eV) and a high value of the bulk modulus (B) that results in an increased hardness, and stability [1, 2]. Experimental studies on BeX (X = S, Se and Te) compounds are less frequently reported probably because of its high degree of toxic nature. The pioneering works by Yim et al. [3], Zachariasen [4], Narayana et al. [5] and Luo et al. [6] were focused on the structural phase transformation and showed that there exists a structural phase transition from the zinc-blend (B3) to NiAs(B8) for these compounds. On the theoretical side, the ab-initio calculations have been extensively used to obtain the structural [7–15], electronic [12–19], elastic [12, 13, 16, 17], lattice dynamical [21–24], thermodynamic [25-27], optical [12, 14,16,18,29, 30] properties for beryllium chalcogenides and their alloys [31–35]. |
| BeS is an interesting material with high hardness. It belongs to the beryllium chalcogenides family and crystallizes under normal conditions with the zinc-blende structure. Under high pressure, the first-principles calculation of Muñoz et al. [36]showed that BeS experiences a phase transition to the nickel arsenide (NiAs) structure. This prediction has been confirmed by the experimental studies of Narayana et al. [5]who reported the existence of a reversible first-order phase transition of BeS from the zinc-blende structure, to the nickel–arsenide structure. |
| The present work is undertaken to study the structure, electronic, elastic and optical properties of zinc-blendBeS under pressure from first principlescalculations. To investigate these properties, we performed ab-initio pseudopotential calculations with the local density approximation (LDA) and generalized gradient approximation (GGA) of the density functional theory (DFT). |
| The rest of the paper is organized as follows. In Section II, we brieflydescribe the theoretical method used in the presentwork. Results and discussion are presented in Section III. A summary of the work is given in Section IV. |
II. THEORETICAL METHOD |
A. Total energy electronic structure calculations |
| The calculations were performed using the Cambridge Series of Total Energy Package (CASTEP) [37-42] code in the framework of density functional theory DFT using Vanderbilt-type ultra-soft pseudopotential [39]for the electron-ion interactions. The exchange-correlational potential of Ceperley and Alder [40] as parameterized by Perdew and Zunger [41] (CAPZ) in local densityapproximation (LDA), and the generalized gradient approximation (GGA) schemes of Perdew-Burke-Ernzerhof [42] (PBE). The electronic wave functions are expanded in a plane wave basis set with cut-off energy of 250 eV. Pseudo-atom calculations are performed for S 3s23p4 and Be 2s2. For the Brillion-zone k-point sampling, we use the Monkhorst-Pack mesh with 4 × 4 × 4 k-points. These parameters are sufficient in leading to well converged total energy, geometrical configurations and elastic stiffness coefficients. |
| Geometry optimization was conducted using convergence thresholds of 1×10⁻⁵eV atom-1 for the total energy, 0.03 eVÅ-1 for the maximum force, 0.05 GPa for maximum stress and 0.001Å for maximum displacement. |
B. Elastic constants |
 |
 |
 |
| Furthermore, Young, s modulus E, rigidity modulus Gr, and Poisson’s ratio γcan be estimated from equations (9) and (10) . |
| Pressure is known to be a powerful tool to change the properties of a solid. One of the most straightforward ways to study theoretically the pressure effects is to perform the structural optimization, electronic, elastic and optical properties calculations at different hydrostatic pressures. |
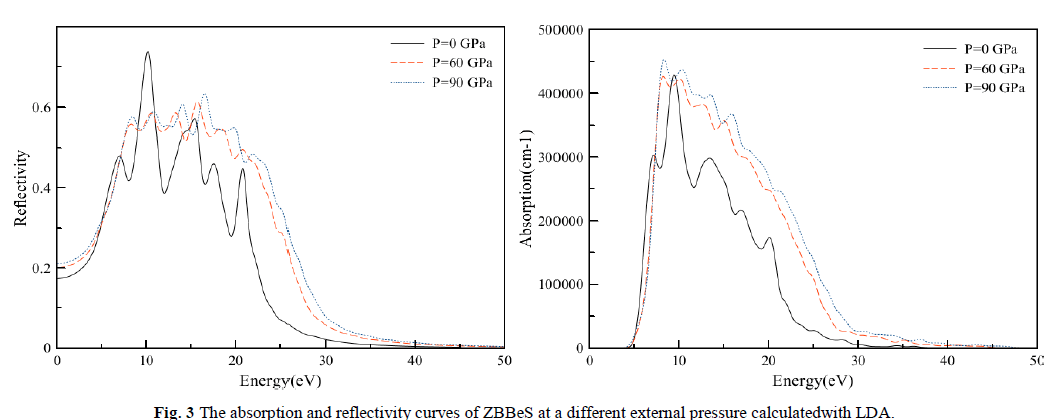
| To study the pressure dependent behavior of the elastic properties of BeS , we mainly focused on the pressure below 100GPa and the calculated pressure dependent results of the LDA and GGA are shown in table 2.A and 2.B, respectively. |
| From the tables 2.A and 2.B, we can see that C11 and C12 vary significantly under different pressures in comparison with the variations of C44 .Moreover both C11 and C12 increase monotonically with pressure, whereas C44 increases slowly. It is clear from table 2 that the adiabatic bulk modulus B increases rapidly with increasing pressure and show a linear variation with pressure, whereas the Poisson ratio first increases and then decreases slowly. Agreement between the LDA and GGA results can be observed, although LDA underestimates the lattice constants and overestimates the lattice constant and overestimates the elastic constants, whereas GGA overestimates the lattice constant and underestimates the elastic constants. We clearly observe that the elastic constants C11, C12 and C44, and bulk modulus B, linearly increase monotonously when pressure is enhanced. |
 |
B. Electronic properties |
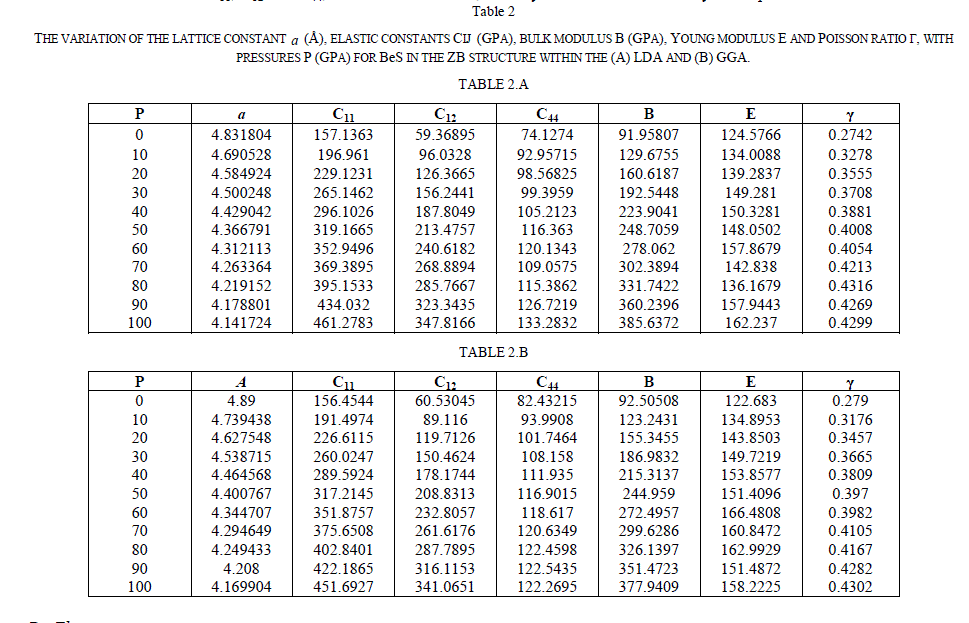
| For the ZB ofBeS, the calculated electronic band structure (left panel)and the totaldensity of state (TDOS) (right panel) along the various symmetry lines at 0 GPa and 60 GPaareillustrated in Figs.1(a) and 1(b), from which we can see that the top of valence band (VB) is at G-symmetry point and the bottom of conduction band (CB) is at X-symmetry point, which suggests that the ZB |
| BeS has an indirect gap occurring between G and X points. Figure 1(a) shows that at 0 GPa, the indirect band gap (GV - XC) is 2.911eV, and the minimum direct gap (GV -GC) is 5.521eV.The direct and the indirect band gaps together with other theoretical results are present in Table 3. In addition, by comparing the TDOS diagram of Fig.1 (a) with that of Fig.1 (b), we can observe that the TDOS at the edges of the band gap decreases with pressure increasing and the valence band of the ZB BeS shifts upwards while the conduction band shifts downwards. It is also observed that the peaks descend with the pressure increasing but the bandwidths become broad, which implies that the electrons in those states are active under pressure. |
 |
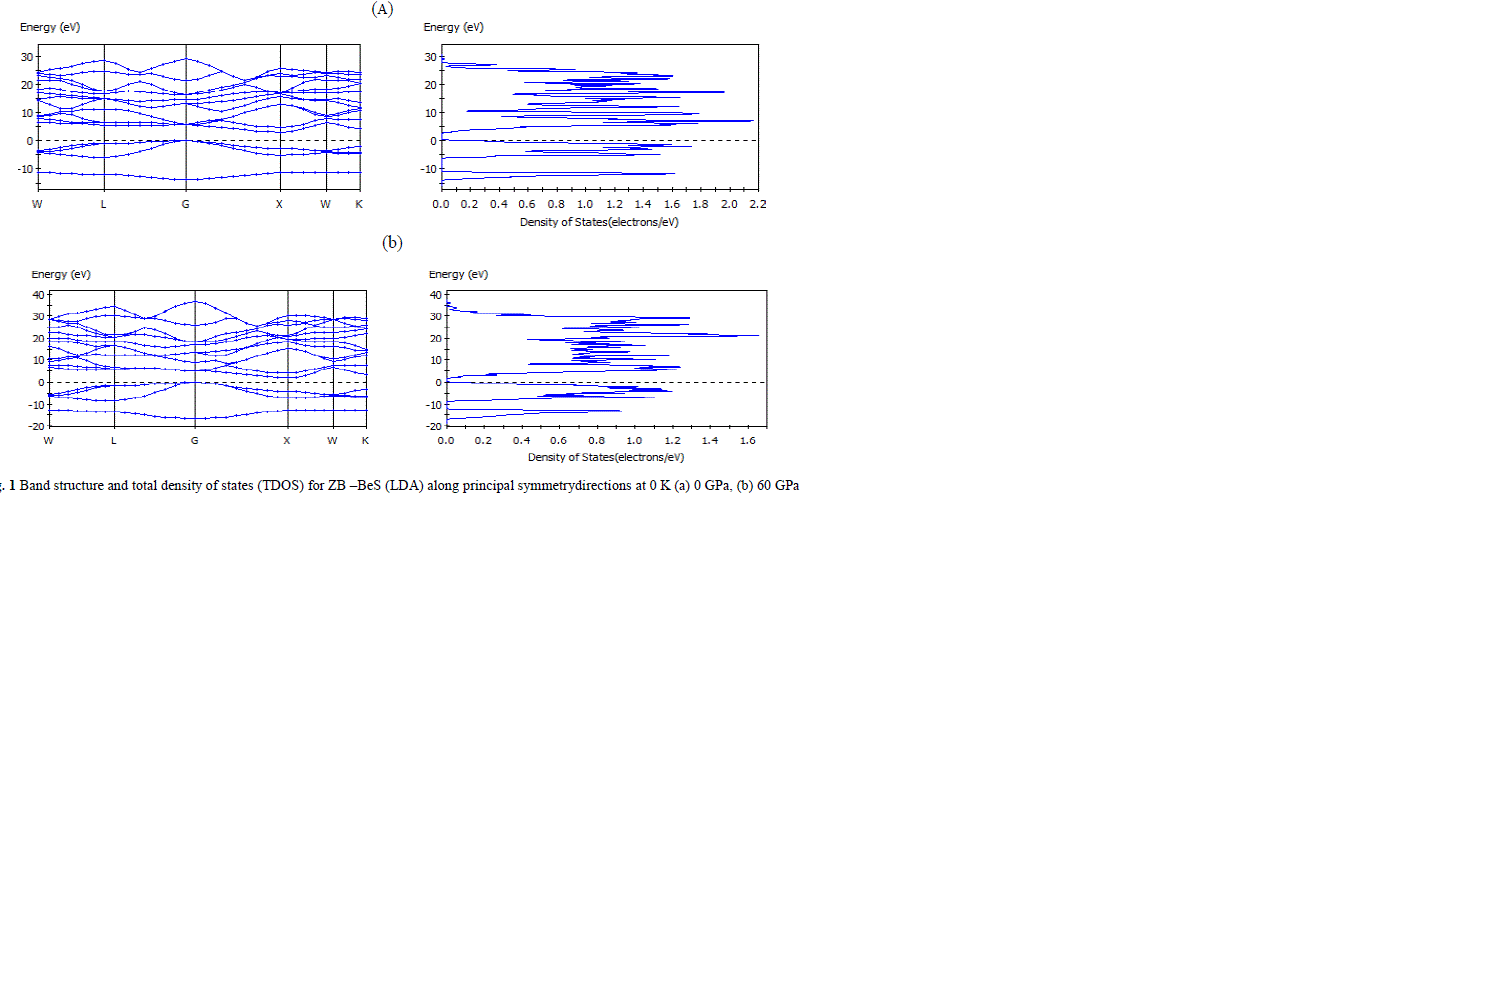
| The partial density of states (PDOS) of the ZB BeS at 0 GPa and 60 GPa have been plotted in Figs.2 (a) and 2(b), respectively, where the Fermi level is set to be 0 point. It is seen that at 0 GPa the peaks of PDOS decrease and extend to flat, which suggests that large hole effective masses and some unusual transport properties may be expected for the p-type semiconductor. For the PDOS at 60 GPa, it is observed that the peaks of Be 2s and S 3p increase and extend to high energies, while those of S 3s decreases. This can be understood as that the S 3p and the Be 2s electrons in those states are active under pressure because of the increase of overlap between the bonds and the changed hybridization. In addition, it is clear that the valence band is mainly composed of p electron while the conduction band is composed of the hybrid s and p electrons. |
 |
 |
C. Optical properties |
| In the following, we tackle the frequency-dependentoptical properties of the ZB structured of BeS, and how external pressure influencesthe optical properties. The complex refractive indexNis generallydefined asN(ω)=n(ω)+ik(ω), where theimaginary partk(ω)is related to the absorption coefficientby equation (16). The complex dielectric constantis also related to the complex refractive index byε(ω)=ε1(ε)+iε2(ω). And the reflectivitycoefficient Ris related to the complex refractiveindex by equation (15). In the present work, the optical properties including dielectric function, absorption equation (16), reflectivity, refractive index, energy-loss function and optical conductivityequation (17) are calculated and analysed. |
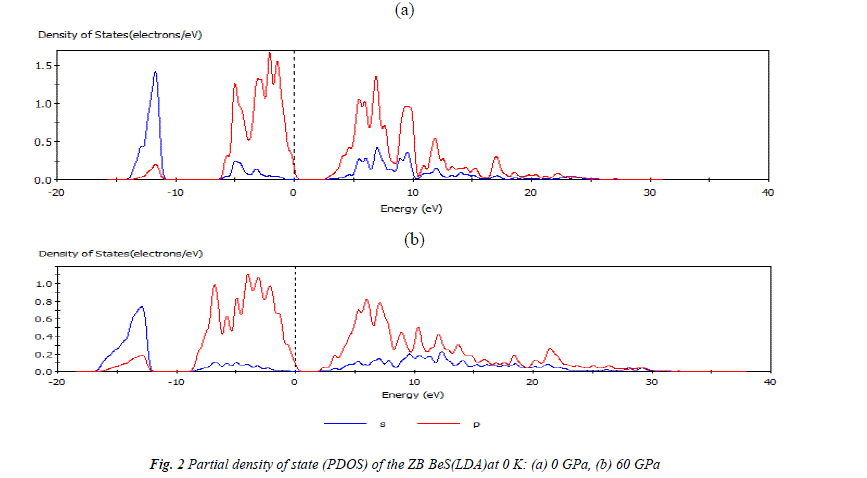
| The absorption coefficient ïÃÂá(ω) and the reflectivity coefficient R(ω)for the ZB structured of BeS at different pressures are shown in Fig. 3. It is not difficult to observed the existence of two remarkable peaksat about 10.13 and 15.23eV,and that there is almost no absorption at the lower energy region about from 0 to about4eVïüÃÅThis no absorption region means that the material is transparentfrom the partially ultra-violet to the visible lightarea because phonon energy at such range is just within the forbidden band. The absorption occurs about from4 to 32eV. This absorption region shifts slightly toward high-energy region and the positions of the peaks are as well move towards the higher energy direction with the increase of pressure. For the reflectivity curve, the first or strongest absorption peak takes place around 10.13eV. However, at high-energy region, where photon energy is larger than about 30 eV, the reflection is very weak and slowly goes to zero with increasing photon energy. Obviously, the corresponding relationship for absorption and reflectionspectra is that in the region where absorption is intense, the reflectivity is also larger. That means if a material can strongly absorb light in some regions, it can also effectively reflect light in the same regions. It is clear from Fig. 3, that the shape of the absorptioncoefficient curve is not sensitive to the pressure. However, the positions ofthe peaks are shifted towards lower wavelength. |
 |
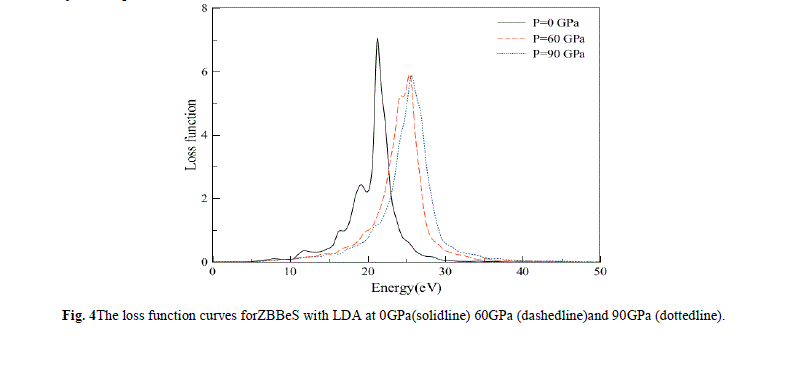
| The electron energy-loss spectrum L(ω) at normal (solid line) and external pressure (dash dot) are shown in Fig. 4. L(ω) describes the energy loss of a fast electron traversing in a material. From Fig. 4, we can see that there are two prominent peaks in L(ω) spectra which represent the characteristics associated with the plasma resonance. The positions of peaks in the L(ω) spectra also indicatethe point of transition from metallic to dielectric material. Also there is a lossless region from 0 to about 8.0 eV. It can be noticed that just frequencies less than 8.0 eV can be transmitted in ZBBeS |
 |
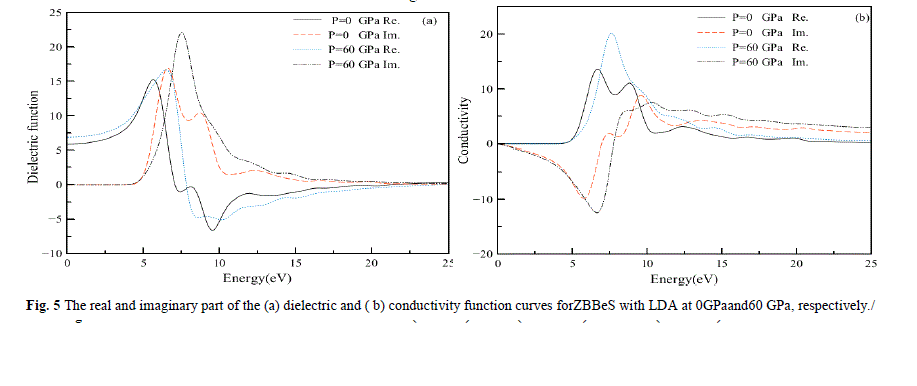
| In Fig.5, we display the (a) dielectric and(b) conductivity function curves for photon energies ranging from 0 eV to 25eV at 0 GPa and 60 GPa separately. It can be seen that in the energy region larger than 20 eV, the values of the imaginary part are very small, while the real part changes very little. In Fig.5a, we display the dielectric function which reflects the band structure of the solid and information about its spectrum .In the real part curve at 0 GPa, there is an obvious peak at 5.54 eV, it is due to the direct interband transitions which originate from the top of the valence band at the L-point to the lowest conduction band. Subsequently, a sharp reduction comes. However, the highest peak in the real part curve decreases with increasing pressure. For the imaginary part of the dielectric function, there also exists such a similar descent, that is, the highest peak in imaginary part curve also decreases with increasing pressure. Many direct or indirect transitions may be found in the band structure with an energy corresponding to the same peak. Thus, the peak in imaginary part ε2(ω).does not correspond to a single interband transition. |
| In Fig.5b, we display the conductivity function curves. The optical conductivity of a semiconductor is the change in conductivity caused by illumination, either an increase or a decrease. The photoconductive effect is the physical basis of optoelectronic applications of semiconductors. The real part of complex optical conductivity (ïÃÂó) is shown in Fig.6b. The optical conductivity corresponding to the imaginary part of the dielectric function is also shown in Fig.6b. The real part of complex optical conductivity is zero when the energy is less than 4.3eV and greater than 22.12 eV. It reaches its maximum when energy is 6.58 eV. This is the result of transitions between bands according to the bands and the DOS. |
 |
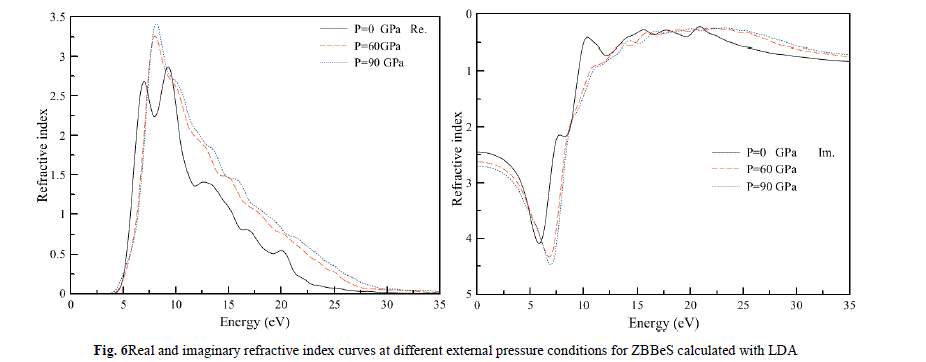
| Finally, we study the influence of pressure on the complex refractive index among optical properties for the ZB BeS. In Fig.6, both the real and the imaginary parts of complex refractive index at different pressures are illustrated. It is clearly seen that in a high-energy region, where the frequency of photons is corresponding to the energy larger than 25 eV, the values of the imaginary part are very small, while the values of the real part change very little. This means that the absorption of the high frequency electromagnetic wave is very weak and the refractive index is almost constant in the high frequency region. In low energy region, where the photon energy is less than 5 eV,the imaginary part is almost zero and the real part is almost constant, which suggests that the optical absorption appears mostly in the ultra-violet region, and there are sharp peaks in the low energy area at about 6.85 eV and 9.10 eV, it can be seen that the pressure has little effect on the shape of the refractive index curve, however, the positions of the peaks shift toward higher energies as shown by the arrows in Fig.6.In conclusion, although the positionof these peaks is shifted under pressure, they are still ofthe same type as those at zero pressure.Moreover, the intensityof these main or global peaks is smaller but wider underpressure. |
 |
IV. CONCLUSIONS |
| We present the structural, electronic, elastic and optical properties of ZB BeS within the LDA and GGA under pressure by abinitio pseudopotential density functional method. We found that the ZB structured BeS has indirect gap and the pressure dependence of energy gap has also been obtained. The present results of LDA agree reasonably with GGA calculations, and the properties at zero pressure are in good accordance with available experimental and theoretical values. An indirect band gap induced by the (G- X) transition is presented, with its value being 2.911 eV. The band calculations are comparable very well to available measurements. In addition, we revealed different behaviors of TDOS and PDOS of the ZB BeS under high pressure. The obtained optical parameters, including the dielectric constant, the electron energy loss function, the refractive, conductivity and the absorption indexes, suggest that the strong absorption spectrum appears mostly in the ultra-violet region, and the optical absorption decreases with photon energy in the high energy range. |
ACKNOWLEDGMENTS |
| The author would like to thank Faculty of Science, School of Physics; Duhok University in carrying out computations on the Theoretical Physics Group (TPG) computers. |
References |
|