ISSN ONLINE(2319-8753)PRINT(2347-6710)
ISSN ONLINE(2319-8753)PRINT(2347-6710)
Sateesh. N. Hosamane1, Dr.G.P.Desai2
|
| Related article at Pubmed, Scholar Google |
Visit for more related articles at International Journal of Innovative Research in Science, Engineering and Technology
Rapid economic growth has brought many benefits to India; the environment has suffered, exposing the population serious air pollution [1]. The consequences of pollution have led to poor urban air quality in many Indian cities. The air pollution and the resultant air quality can be attributed to emissions from transportation, industrial and domestic activities. The air quality has been, therefore, an issue of social concern in the backdrop of various developmental activities. Though the measurement of air quality is complicated, there are a few pollutants which regulators keep a watchful eye on through regular monitoring. The most watched pollutants include particular matter (PM), nitrogen dioxide (NO2), sulphur dioxide (SO2) and carbon dioxide (CO2)[2]. Due to pollution, the ambient air quality in major cities in India is now very poor. The annual average concentration of suspended particulate matter (PM10) is very high in Indian cities. In particular, many cities have exceeded the officially designated critical levels, not to mention the ambient air quality standards set by the World Health Organization (WHO). There is an urgent need to adopt various strategies in planning air quality, total air quality control to improve urban air quality. Epidemiological studies should be taken up to show how ambient air pollution is affecting people‟s health and quantify this information in order to provide policy tools for air quality planning. Exposure to air pollutants is largely beyond the control of individuals and requires action by public authorities at the national, regional and even international levels. The norms for ambient air quality have been revisited and various industry specific emissions standards are to be revisited and notified from time to time
Keywords |
| AIR POLLUTION, PM10, NO2, SO2. |
INTRODUCTION |
| Increase in technological, industrial and agricultural advancement, coupled with increases in population growth, has triggered the deterioration of environmental quality throughout the world. Rapidly growing cities, more traffic on roads, growing energy consumption and waste production, and lack of strict implementation of environmental regulation are increasing the discharge of pollutants into air, water, and soil [3]. Urban ambient air pollution is the result of emissions from a multiplicity of sources, mainly stationary, industrial and domestic fossil fuel combustion, and petrol and diesel vehicle emissions [4,5]. Fossil fuels, the primarysource of energy consumption, are the greatest source of ambient air pollution, producing nitrogen oxides, sulfuroxides, dust, soot, smoke, and other suspended particulatematter. These pollutants can lead to serious public health problems, including asthma, irritation of the lungs, bronchitis, pneumonia, decreased resistance to respiratory infections, and premature death. The burning of fossil fuels is also the major source of carbondioxide emissions, a primary contributor to global warming [6]. Motor vehicles emit PM, nitric oxide and NO2 (together referred to as NOx), carbon monoxide, organic compounds, and lead. The chemical composition of the atmosphere is being altered/changed by the addition of gases, particulates and volatiles substances, which may be toxic to living beings. The levels of air pollutants are rapidly increasing in urban and rural areas in many megacities (urban population greater than 10 million) of the developing world [7]. The air pollutants so generated are detrimental to human health. In addition, they cause negative impacts directly or indirectly, if at elevated concentrations, on vegetation, animal life, buildings and monuments, weather and climate, and on the aesthetic quality of the environment. Most Asian cities cannot comply with the WHO air quality guidelines or the US Environmental Protection Agency standards; exceptions are cities in more developed countries such as Singapore, Taiwan, and Japan. Several Asian cities in China, India, and Vietnam have the highest levels of outdoor air pollution in the world [8]. In 1998, National Environment Protection Council(NEPC) made the Ambient Air Quality National Environment Protection Measure (AAQ NEPM) that set national ambient air quality standards to apply in all States and Territories and over land controlled by the Commonwealth. These standards cover six common pollutants are particles (PM10), ozone, sulfur dioxide, nitrogen dioxide, carbon monoxide and lead. The NEPM provides a nationally consistent framework for the monitoring and reporting of these six pollutants [9]. The World Health Organization estimates that air pollution contributes to approximately 800,000 deaths and 4.6 million lost life years annually [10]. Developing nations are particularly affected by air pollution; as many as two thirds of the deaths and lost life years associated with air pollution on a global scale occur in Asia[11]. To date, estimates of the health effects resulting from exposure to air pollution in Asia have relied largely on the extrapolation of results from research conducted outside Asia primarily in Europe and North America [9]. India need to generate regular information on the ambient concentration levels of small particulates of diameter less than 10 micron and/or 2.5 micron and take urgent steps to control emissions of these particles [12]. |
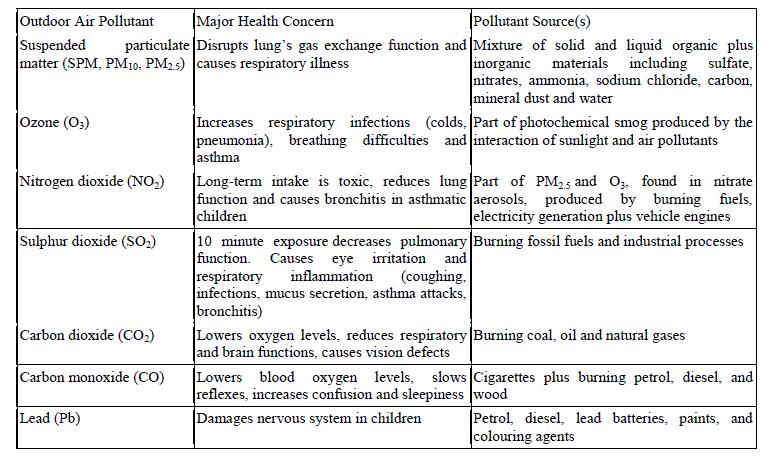 |
| Limited data available from the Central Pollution Control Board (CPCB) indicate that the levels of small particles less than 10 micron (PM10) are very high. This size of particulates is known to cause severe damage to the lungs. In fact, the World Health Organization (WHO) reports that there is no safe level for particulate matter emissions [13]. International studies have confirmed association between elevated levels of particulate air pollution and decline in lung function or increase in respiratory symptoms such as cough, shortness of breath, wheezing and asthma attacks. Studies have also found associations between particulate air pollution and rates of hospitalization, chronic obstructive pulmonary disease and restricted activity due to illness [14]. The new scientific information emerging from international studies indicates that the cancer causing potential of diesel exhaust is very high. The Scientific Review Panel of the California Air Resources Board points out based on human epidemiological data, that a chronic exposure to 1 mg/cm3 of diesel exhaust will lead to 300 additional cases of lung cancer per million people [15]. WHO has study report on rats shows thatchronic exposure to 1 mg/cm3 of diesel exhaust can lead to lung cancer per million[13]. |
| The diesel exhaust accounts for a significant proportion of small particles including sulfates in the air. The first survey of PM10 in Delhi shows that they reach extremely high levels as much as 500 mg/cm3 or 5 times higher than the standard prescribed by the CPCB[14].Diesel also produces NOx that is easily absorbed in the blood and then reduces the oxygen carrying capacity of the blood. It makes the lung tissues brittle and leathery and can cause lung cancer and emphysema (severe breathing problems)[17]. The increasing awareness of scientists and public about the acute and chronic health effects of several traffic-related pollutants (NO2, CO, hydrocarbons, particulates etc.) has led in recent years to a significant number of relevant epidemiological studies in urban populations. Although the complexity of the mechanisms and factors are not fully explained, epidemiological studies, conducted to date, has highlighted a wide range of apparent health effects, including increased risks of morbidity and mortality due to respiratory illness, cardio-vascular disease and cancer [18, 19, 20]. |
WHO GUIDELINE |
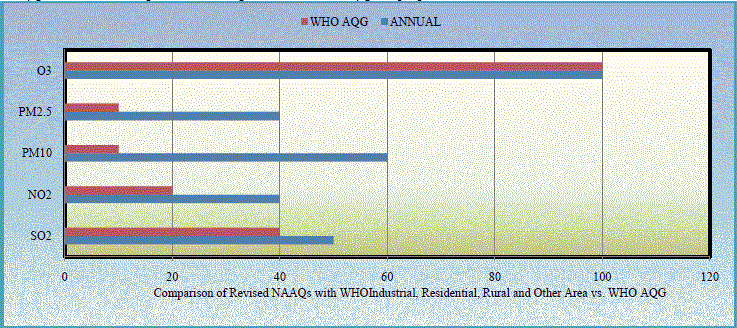
| Air pollution, both indoors and outdoors, is a major environmental health problem affecting everyone in developed and developing countries alike. The 2005 WHO Air quality guidelines (AQGs) are designed to offer global guidance on reducing the health impacts of air pollution. The guidelines first produced in 1987 [21] and updated in 1997 [22] had a European scope. The new (2005) guidelines apply worldwide and are based on expert evaluation of current scientific evidence. They recommend revised limits for the concentration of selected air pollutants: particulate matter (PM), ozone (O3), nitrogen dioxide (NO2) and sulfur dioxide (SO2). |
 |
INDIA ECONOMIC GROWTH |
| The level of development measured by per capita GDP, as a country reaches a certain level of GDP; environmental pollution tends to decrease as income increases. Over the last three decades, the world has been astonished by the miraculous economic growth of India. For instance, during 1978-2010, the average real rate of GDP growth is 5.8% in India [23]. High growth has been achieved with severe environmental damages such as deforestation, widespread acid rain and deteriorating ambient air quality. These consequences threaten human living space and health, and are costly to deal with. In India it is estimated that the damage and degradation of natural resources is equivalent to about 10% of the countryâÃâ¬ÃŸs GDP [24]. While these estimates may be debatable, there is no doubt that pollution has serious health and economic consequences. |
 |
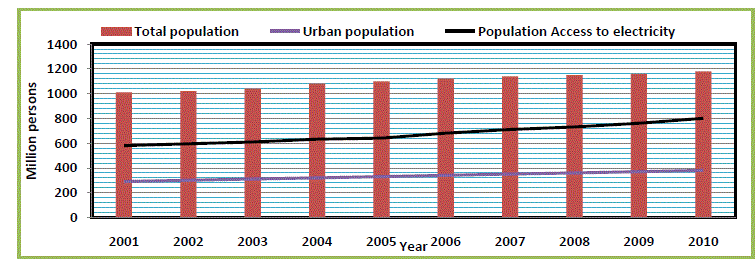 |
| The empirical study will result in a quantitative association between income and environment pollution levels, particularly the relationship of income with three widely monitored air pollutants: PM10, SO2 and NO2. The study will also look into the effect of other variables such as population density, gross capital formation, road sector energy consumption and other variables which may significantly affect pollution levels [24]. |
AIR POLLUTION CONTROL STRATEGIES IN INDIA |
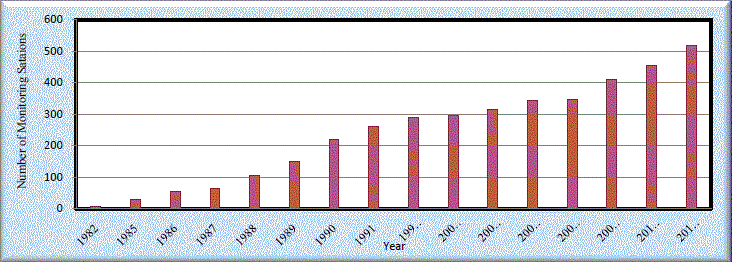
| India has a relatively extensive set of regulations designed to improve both air and water quality. The environmental policies have their roots in the Water Act of 1974 and Air Act of 1981. These acts created the Central Pollution Control Board (CPCB) and the State Pollution Control Boards (SPCBs), which are responsible for data collection and policy enforcement, and also developed detailed procedures for environmental compliance. The CPCB and SPCBs quickly advanced a national environmental monitoring program (responsible for the rich data underlying our analysis). The Ministry of Environment and Forests (MoEF), created in its initial form in 1980, was established largely to set the overall policies that the CPCB and SPCBs were to enforce [25]. Starting in 1987, IndiaâÃâ¬ÃŸs Central Pollution Control Board (CPCB) began compiling readings of Nitrogen Dioxide (NO2), Sulfur Dioxide (SO2), and particulate matter with diameter less than 100μm (PM). The data were collected as a part of the National Air Quality Monitoring Program (NAMP), a program established by the CPCB to help identify, assess, and prioritize the pollution controls needs in different areas, as well as to help in identifying and regulating potential hazards and pollution sources[26]. The CPCB reports that there are currently 365 functional air quality monitoring stations in 127 Indian cities, there has been much movement and reclassification of these monitors over the years[27]. |
 |
| Particulate matter (PM) is regarded by the CPCB as a general indicator of pollution, receiving key contributions from fossil fuel burning, industrial processes and vehicular exhaust, SO2 emissions, on the other hand, are predominantly a by-product of thermal power generation; globally, 80 percent of sulfur emissions in 1990 were attributable to fossil fuel use [28]. NO2 is viewed by the CPCB as an indicator of vehicular pollution, though it is produced in almost all combustion reactions. |
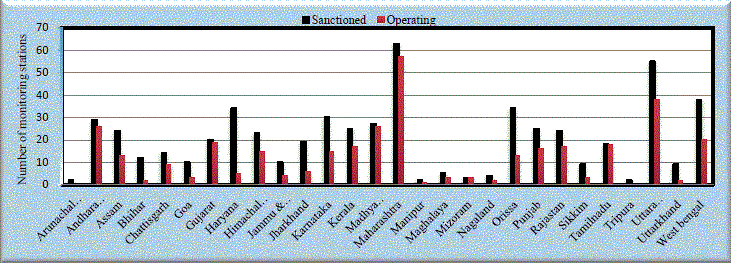 |
| Under NAMP, four air pollutants are Sulphur dioxide (SO2), Oxides of nitrogen as NO2 and Suspended particulate matter (SPM) and Respirable suspended particulate matter (RSPM/PM10), have been identified for regular monitoring at all the locations. |
 |
AIR POLLUTION TREND IN INDIA |
| India is now ahead of China and everyone else in having the dubious distinction of having the worldâÃâ¬ÃŸs most polluted air. Earlier this year an Environment Performance Index (EPI) report placed India at the bottom of the 132 countries assessed[29]. Air in some Indian cities has particulate matter (PM) levels 5 times above safety limits [28].The PM10 levels are the biggest cause of health concern. In 2007, nearly 52% (63) cities were at critical PM10 levels (≥1.5 times limit). Higher PM10 levels were found in northern Indian cities with continuous increases in Mumbai, Faridabad, Lucknow, Bangalore and Delhi. In recent times, SO2 levels have dropped in most cities except for some high level areas such as Khurja, Nashik, Jamshedpur and Chandrapur. However, NO2 levels are on the rise all over India because of the rise in the number of vehicles[28]. The ambient PM concentrations fell quite steadily over the sample timeframe, from 252.1μg/m3 in 1987-1990 to 209.5μg/m3 in 2004-2010. This represents about a 15 percent reduction in PM. The SO2 trend line is flat until the late 1990, and then declines sharply. Comparing the 1987-1990 to 2004-2010 time periods, mean SO2 decreased from 19.4 to 12.2μg/m3. NO2 appears more volatile over the start of the sample period, but then falls after its peak in 1997 [30] The 10th percentiles of PM and SO2 pollution both declined by about 13 percent from 1987-1990 to 2004- 2010. However, the distribution of NO2 across cities does not appear to change much over the sample time frame. In fact, if anything, the distribution of pollution appears to have worsened, with the 10th percentile rising from 8.5 to 10.4μg/m3 and the 90th percentile rising from 42.6 to 47.0μg/m3 [30]. |
 |
AIR POLLUTION STATUS IN INDIAN CITIES |
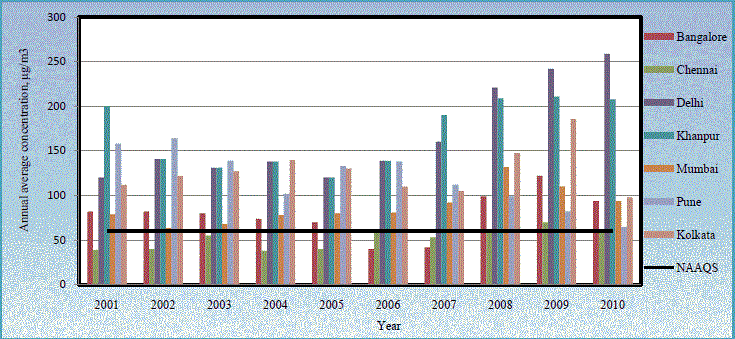
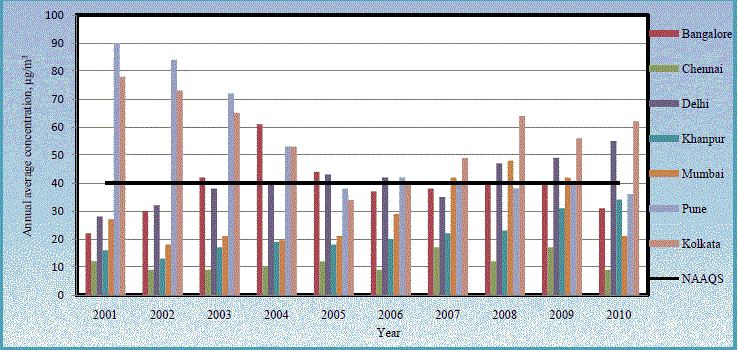
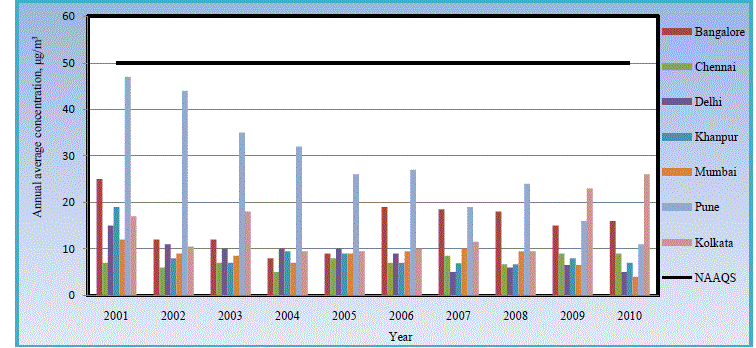
| The air quality data generated by the Central Pollution Control Board (CPCB) for 2007 under the National Air Quality Monitoring Programme (NAMP) presents deadly facts about air pollution levels in Indian cities.Centre for Science and Environment has analysed the official data to assess the state of air quality and trend in Indian cities. The most widely monitored pollutants in India are particulate matter (PM), nitrogen dioxide (NO2), sulphur dioxide (SO2), and on a limited scale carbon monoxide.Almost half of the total cities monitored under NAMP have critical levels of PM10. CPCB classifies cities as critically polluted if the levels of criteria pollutants are more than 1.5 times the standards. Levels up to 1.5 times the standards are labeled high. Levels that reach up to 50 per cent of the standards are moderate. Indian cities are reeling under heavy particulate pollution with 52 percent of cities (63 cities) hitting critical levels (exceeding 1.5 times the standard), 36 cities with high levels (1–1.5 times the annual standard) and merely 19 cities are at moderate levels, which is 50 per cent below the standard[27]. The air pollution trends in seven cities were analyzed for three major pollutant levels in RSPM, NO2,SO2.The seven cities selected for the present study are âÃâ¬Ã Bangalore(Karnataka); Chennai (Tamil Nadu), Delhi(Delhi), Khanpur(Uttar Pradesh), Mumbai(Maharashtra), Pune(Maharashtra), Kolkata(West Bengal). |
STATUS OF RSPM |
| The annual average concentration of major cities in India shows a fluctuating trends in RSPM levels,indicates increasing trend in Delhi, Mumbai and Kolkata but for Chennai it shows decreasing trend.The reason for high particulate matter levels is attributed by vehicular traffic, Diesel/Kerosene generator sets, small-scale industries, biomass incineration, suspension of traffic dust, commercial and domestic use of fuels. |
 |
STATUS OF NO2 |
| The annual average concentration of major cities in India shows a fluctuating trends in RSPM levels but indicates decreasing trend but the concentration is above the NAAQS is observed in Banglore, Delhi, Khanpur, Mumbai and pune. In many cities the levels declined up to 2004 however there is an increasing trend observed again in past two years. Southern Indian cities show a rising trend especially in Bangalore, cities in western India are relatively better off with almost constant to declining NO2 levels, though the levels indicate an increasing trend in Delhi and Khanpur. |
 |
STATUS OF SO2 |
| It has been observed that, trend of Sulfur dioxide is not considered a problem in India. Its levels in most cities are already very low and declining. However, Pune has moderate levels. As per the literature, during 2010 National Ambient Air Quality Standard (NAAQS annual average) was not exceeded at any monitoring station in residential and industrial areas. SO2 levels at 75 per cent of the monitoring stations in industrial areas and 90 per cent of the monitoring stations in residential areas were less than 25 μg/m3, although SO2 levels at none of the monitoring stations exceeded the annual average standard. |
 |
CONCLUSION |
| Air quality monitoring data clearly showed lower concentrations of gaseous pollutants (SO2 and NOx) and higher concentrations of SPM and RPM in the ambient air. The incidence of higher rate of respiratory diseases among the people of selected cities could be attributed to higher concentration of SPM and RPM in the ambient air. Under long term exposure, there is correlation between particle concentrations and mortality form lung disease [31]. The literature review shows that that Suspended Particulate Matter (SPM) is the main problem of urban air pollution in India. The main cause of air pollution is mainly due to fast growing population of automobiles and poor traffic control, congested roads. To overcome this development and planning of city and public awareness play very important role to reduce the ambient air pollution. Various measures such as implementation of Bharat Stage-III norms have been strictly implemented to mitigate ambient RSPM which have been shown exponential increase in number of vehicles. Central air pollution board is reported that, NO2 levels at 35 % of the monitoring stations in industrial and residential areas were low. High levels of NO2 were observed at 48% and Critical levels of NO2 were observed at 13% of the locations. The decreasing trend in sulphur dioxide is been observed in India these levels may be due to various measures taken such as reduction of sulphur in diesel, use of LPG instead of coal as domestic fuel conversion of diesel vehicles to CNG. |
References |
|