ISSN ONLINE(2278-8875) PRINT (2320-3765)
ISSN ONLINE(2278-8875) PRINT (2320-3765)
SadaShiva Bayya1, I.S. Rajay Vedaraj .S 2, K Sivasubramanian3
|
| Related article at Pubmed, Scholar Google |
Visit for more related articles at International Journal of Advanced Research in Electrical, Electronics and Instrumentation Engineering
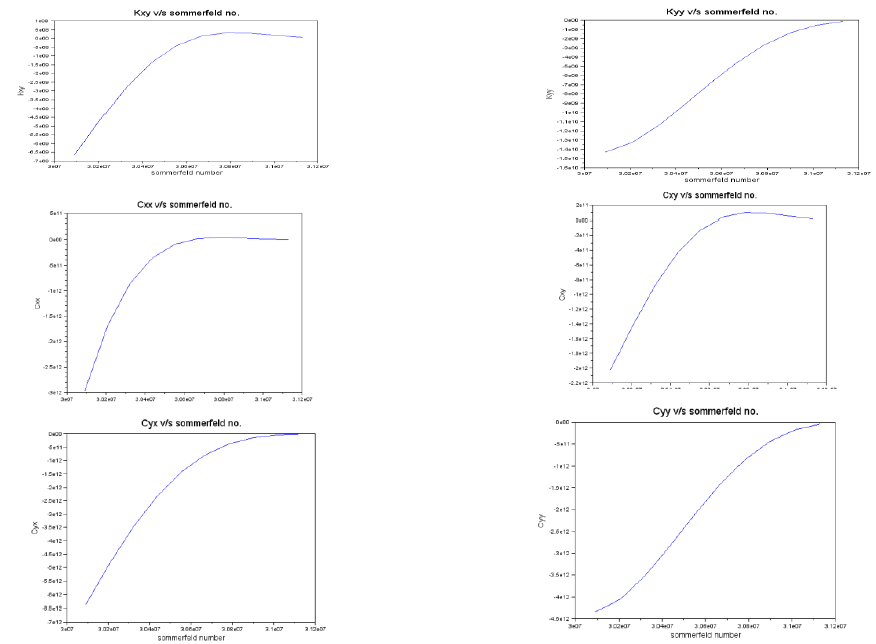
The four main components of machinery management are monitoring, protection, machinery analysis and proactive machinery control. Themonitoring system implements the role of monitoring and protecting machinery. However due to its many different forms of communication to outside systems, it provides the data to the systems that can analyse the machinery responses and make decisions to assist the machinery management process. Various transducers translate the mechanical energy into electrical and then transmit them to the monitoring system over the field wiring. The monitoring system accepts the signal and processes it, calculating related quantities, such as the variables amplitude, phase. The monitoring systems also provide access points for the data signal to be provided to other devices. The proximity transducer system is used in the project to obtain the voltage signals and the probe calibration values are found both mathematically and through the use of calibration equipment. The various conditions that led to the use of proximity probes, including probe cable length(s), supply voltages, the types of target materials etc are identified. There are three different software packages which are to be used namely the Rack configuration software for the purpose of configuring the data collector modules.The mathematical model of the individual components are elaborated to analyse vibrations. The mathematical model is based on Finite Element Method. After simulating the dynamic behaviour of the rotor-bearing system with the normal operating conditions, it is possible to predict the stability range based on the variation in values of stiffness and damping coefficients. With the help of the SCILAB code all the direct and cross coupled stiffness and damping coefficients are calculated and their dependencies on the Sommerfeld number are observed using various plots.
Keywords |
| Vibration monitoring, Mathematical modelling, SCILAB simulation |
INTRODUCTION |
| The monitoring system is a full feature monitoring system that supports increasing plant safety, reducing plant operating costs, improving product quality and maximizing plant availability. The goals of the monitoring system design are:To support an increase of plant safety by allowing the monitoring and protection of a critical machinery, To create a system that is lower in price per channel than previous monitoring systems and that keeps the costs down by minimizing loss if machinery does experience a potentially catastrophic failure, To continually improve the quality of the monitoring system. |
II. SYSTEM COMPONENTS |
| The system components consist of the transducers, the field wiring, the monitoring racks, the computers and the software.Each monitor module can be configured to support several different monitoring conditions and measure required parameters. Alarm setpoints can be adjusted in both the configuration software and the System1 software, while the data is being observed. Alarm setpoints are entered digitally so that consistent, reliable setpoints can be implemented for each channel. |
| The eddy current Proximitortransducers convert one form of energy into another. In case of proximity transducers, mechanical energy is transformed into electrical energy using the proximity transducer system. The interface device used for this system is called a Proximitor. It has two basic functions: |
| 1. Generates a radio frequency (RF) signal using an oscillator circuit. |
| 2. Conditions the RF signal to extract usable data using the demodulator circuit. |
Proximitor and Probe Operation |
| Once the proximitor’s oscillator has power it will generate an RF signal at a specific frequency. The RF signal frequency will be within a range from 500 Kilohertz to 2.0 Megahertz. The RF signal is transmitted from the probe coil which creates an RF field around the probe tip. |
The Eddy Current Flow |
| When conductive material is present in the RF field, Eddy current flow in the surface of that material. The penetration depth of the eddy current depends on the material’s conductivity and permeability. |
Vibration signal |
| If the target is moving slowly within the RF field, the signal amplitude increases or decreases slowly. If the target is moving rapidly within the RF field, the signal amplitude increases or decreases rapidly. Oscillatory movement of the target causes the RF signal to modulate. |
Demodulator Operation |
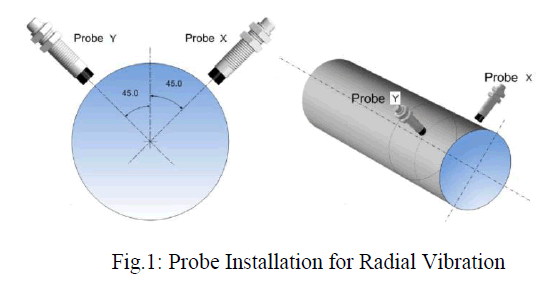
| The demodulator circuit deals with slowly or rapidly changing signal amplitude in the same way. If the target is not oscillating, as might be the case with a thrust probe, the proximitor output is a constant DC voltage, called the gap. If the target is oscillating (gap changing slowly or rapidly) the proximitor’s output is a varying voltage (AC). If the probe is observing a vibration, the proximate will provide an AC (vibration) component in the output signal. Here we are considering a 500MW steam turbine which is considerably a heavy critical machinery. Two eddy current transducers are installed at each bearing for measuring radial vibration and two transducers for axial vibration. |
 |
Rack Interface Module |
| There are two Rack Interface Modules (RIM) available for the monitoring system. These modules support the system by implementing the communication to outside systems and by monitoring the statuses of the data collector modules in the rack. |
Configuration of power supplies |
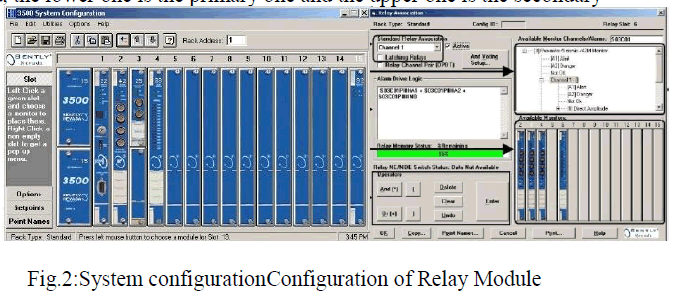
| The monitoring system two power supplies, although two are required if the TMR system is used. If there are two power supplies installed, the lower one is the primary one and the upper one is the secondary |
 |
Data Acquisition |
| Data acquisition software has been used to manage the data into our system. The input data enters DAQ software through the data collector module where continuous sampling of data takes place. The software operates on the data acquisition server computer which has been assigned to a historical database. |
System1 display software |
| This software allows us to view, analyse, compare, list and print data collected by the hardware and software components that interface with the system1 platform which includes the transient data interface communication processor and the various instrumentation systems. |
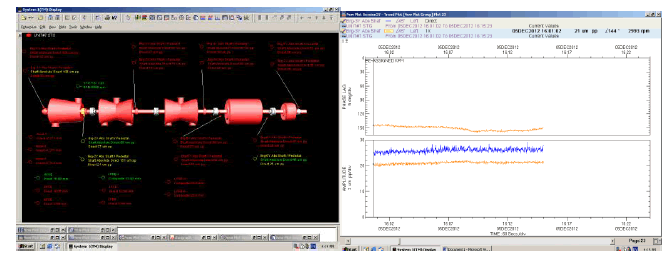 |
| The system1 software display of the enterprise comprising of the machinery and the continuous spectral data monitored and displayed |
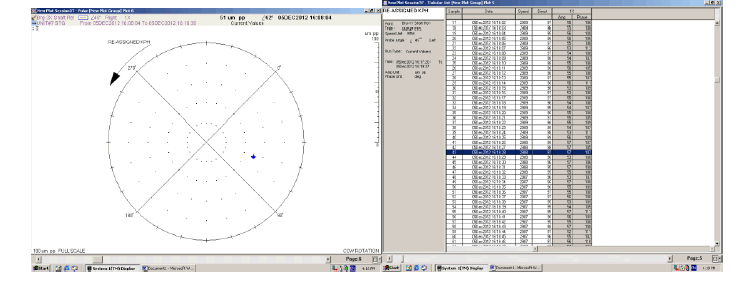 |
| The orbit plot for journal centre displacementContinuous data being collected |
III. MATHEMATICAL MODEL |
Transformation Matrices |
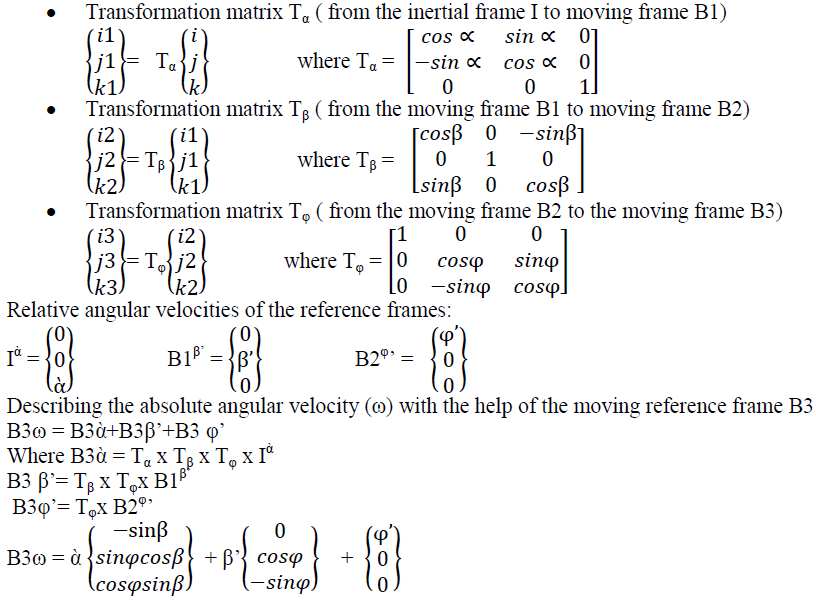
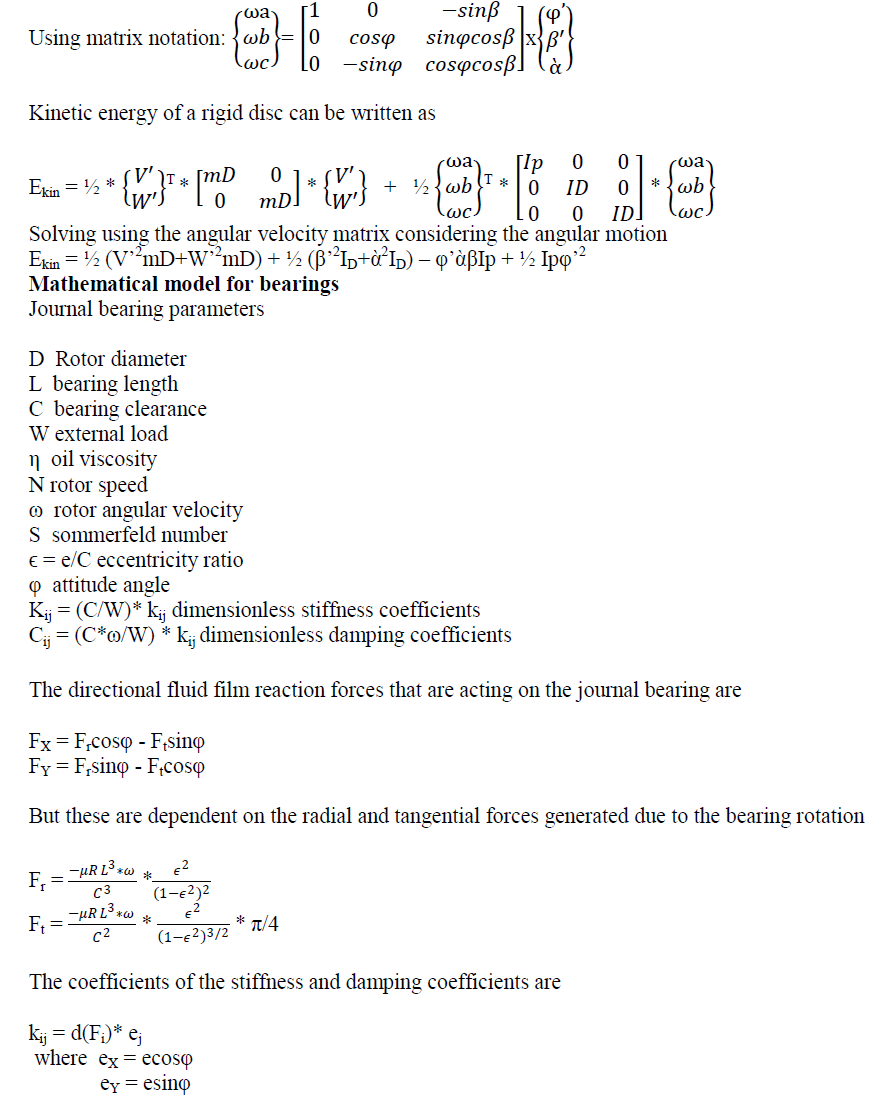
| Considering three consecutive rotations it is possible to define three moving reference frames and three transformation matrices |
 |
 |
 |
 |
CONCLUSION |
| Continuous monitoring of the vibration amplitude has been established and the system model is elaborated. All the stiffness and damping coefficients are calculated and simulated with the fluctuating speeds and their variation with the Sommerfeld number are observed which ultimately signify the stability of the bearing and the fluid film lubrication present in the bearing. |
References |
|