ISSN ONLINE(2278-8875) PRINT (2320-3765)
ISSN ONLINE(2278-8875) PRINT (2320-3765)
F.A. Althowibi 1 ,M.W. Mustafa 2
|
| Related article at Pubmed, Scholar Google |
Visit for more related articles at International Journal of Advanced Research in Electrical, Electronics and Instrumentation Engineering
Voltage instability and voltage collapse have been considered as a series threat to power system operation. Fast response and accurate voltage stability indications in power systems are still a challenging task to achieve, particularly when power systems operated close to its transmission capacity limits. A successful avoidance of system collapse is based on method accuracy and its low computation time. This paper presents simple, fast and efficient indices for analysing power system voltage stability and successfully predicting system voltage collapse. Four indices are proposed; which are based on the gradient of generated powers with respect to load components producing sensitive voltage stability indications.The SPqandSQp response sensitively when real load power changes with clear and readable indications while SPqandSQqmeasured system sensitivity to any demanded reactive power changes. This describes clearly the dynamics of power transfer through the transmission systems and how the system responses to load changes indicating how the system regain its load-generation equilibrium when load rate changes. A demonstration on the IEEE 14-bus, 57-bus and 118-bus systems are presented to validate the propose indices’ efficiency and accuracy.
Keywords |
| Voltage stability analysis, voltage collapse, voltage stability index, sensitivity to voltage collapse |
 |
INTRODUCTION |
| Electric power utilities are being under pressures by governments’ agency, politics, economy and residential and industrial customers to provide reliable and uninterrupted service from power plants to loads. Unfortunately, a few utilities are able to construct new power plants and advance their systems targeting high reliability standard while others are forced to operate near their functioning design limits due economic and environmental constraints or because of the shortage in power delivery investment. Due to such operation, new types of instability have been formed characterized new behaviour of system dynamics such voltage instability in load areas which could be the major cause to partial or total system collapse. |
| Several blackout events associated with voltage instability have been recorded worldwide costing millions of dollars, and still a threat to power system security. Blackouts events have occurred recently in Germany in 2006 , Russia in 2005 [1-3] and Greece in 2004 [4, 5]. In 2003, several blackouts occurred in Europe: in Italy [1], Sweden- East Denmark Sweden-East Denmark[1], London- UK [6] and Croatia and Bosnia Herzegovina [7] while a major blackout were recorded in north America, USA and Canada [8]. These recent blackout incidents are mostly caused by faults, equipment and device failures, unwanted relay operations, rapid and unexpected load increase, shortage in reactive powers, human errors, or by the lack of smart power system tools and intelligent protection devices. |
| As a voltage collapse problem has become a point of concern for utilities and academic researchers, several models have been employed in voltage collapse studies. Dynamic and static approaches are the most dominant use in voltage stability studies. The dynamic analysis is very useful in providing an insight into the nature of voltage collapse event coordinating between protection and control devices and testing in remedial measures while the static analysis provides an insight into the nature of voltage instability and determining the key contributed factors [9, 10]. |
| Although voltage instability in power system is a dynamic phenomenon and its analysis is favored by some utilities, voltage instability has been viewed as a steady-state problem suitable for static analysis methods. Static voltage stability analysis is commonly used in research and on-line applications providing a fast and clear insight of voltage stability problem. Some methods proposed in the literature use the singularity of power flow model, Jacobian matrix, [11-13]or to calculate the reduce Jacobian determinates [14], compute the eigenvalue [15, 16], determine the smallest singular value of the dynamic state Jacobian matrix [17, 18] or identify the critical buses using tangent vector [19]. Another approach then were taken to determine maximum loadability point [20], estimate system collapse based on quadratic approximation of PV-curves [21] or minimize load voltage deviation [22]. |
| In recent research, a second order approximation of the saddle nod bifurcation is introduced in [23] while instability detection using anti-colony optimization established in [24]. Reference [25] develops voltage collapse prediction index (VCPI) to evaluate voltage stability problem and reference [26] presents linear and nonlinear analysis tools to evaluate voltage stability whenever a small disturbance is occurred, while an improvement to voltage stability index designated as Lijwith the influence of load modelling is presented in [27]. |
| A new protection scheme with a deviation approach was presented in [28] introducing two sensitivities terms as TRGGP and TRGGQto screen maximum available margin. A non-iterative approach was proposed in [29] as a tool of voltage stability evaluation while an equivalent local network model with node index proposed in [30] to detect the point of voltage collapse and identify the critic node bus while Reference [31] introduced a performance index for distributed monitoring of system-wide quasi-static voltage instability based on the smallest singular value sensitivity of power flow Jacobian matrix. |
| These methods are different in their approaches, applications or applied conditions making their analyses somehow vulnerable. Some of them might be robust or precise, but may be time consuming for large power systems others may fail if any power system element is involved like control devices. Clear indications, lower computation time and accuracy are needed to prevent such blackout event and avoid voltage instability. |
| This paper proposes new indices to conduct power system sensitivity to voltage collapse based on generated real and reactive powers predicting how the system response to load dynamic behaviour. Four indices are proposed; two for indicating the sensitivity of generated real powers to load components designated as SPpand SPqwhile SQpand SQq indicate the sensitivity of generated reactive powers to load active and reactive powers. These developed indices provide how the power system reacts due to any load changes and at which point the system is collapsed based on generation power availability. SPp,SPq, SQpand SQqindices produce sensitive indications of voltage stability for the system as a whole and a separate bus analysis can be achievable. Simplicity, speediness and accurate voltage collapse prediction or detection is confirmed in the results section, reducing computation time and allowing operators and controls to act with sufficient time. The performance of these indices have been demonstrated on the IEEE 14- bus,IEEE 57-bus and 118-bus Test System to show their effectiveness and efficiency. |
| The paper is organized as follows: Section II presents the proposed voltage collapse indices while section III demonstrates a quick review of voltage stability methods. Then, paper results are discussed in section IV and the conclusions follow in section V. |
THE PROPOSED INDICES |
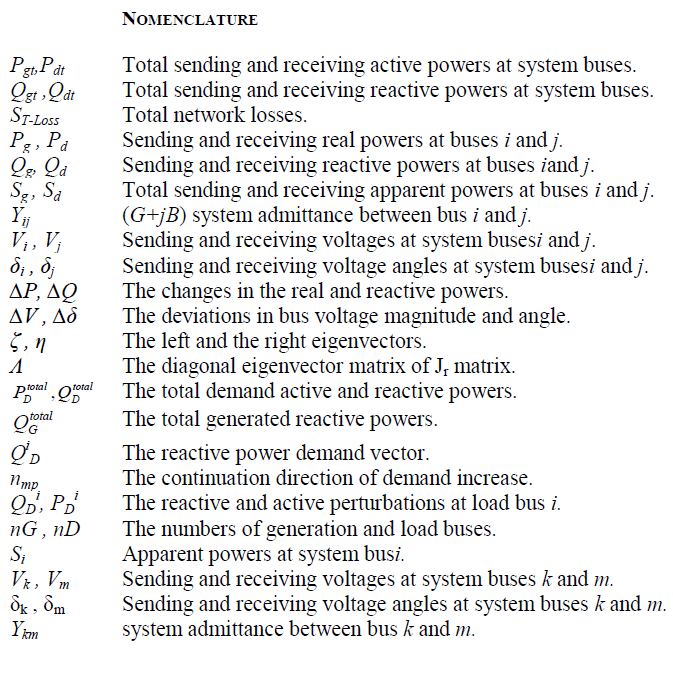
| The paper proposed four indices of conducting generated powers sensitivity to voltage collapse. Two sensitive indices are for the generated real powers to loads donated as SPpand SPqwhile the second sensitive set are for the generated reactive powers to load components designated as SQpand SQq. These sensitive toolsare based on the behaviour of load power components and used to measure how far the system is from its collapse point. Here, the generated real power sensitivity set is derived first from load flow equations and, then, the derivative of generated reactive power sensitivity set is followed. |
A. Generated real powers Sensitivity Set |
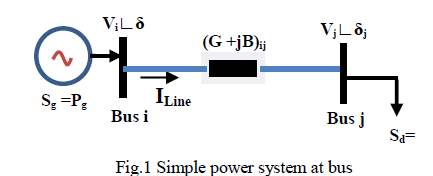
| The system shown in, Fig.1 is representative of general power system connecting a generator with load through transmission-line. As the equivalent generator modelled in normal state, it is assumed that the generator voltage, E, is in normal condition and equal to the voltage at generation bus Vi, preserving constant value using generator excitation systems. |
 |
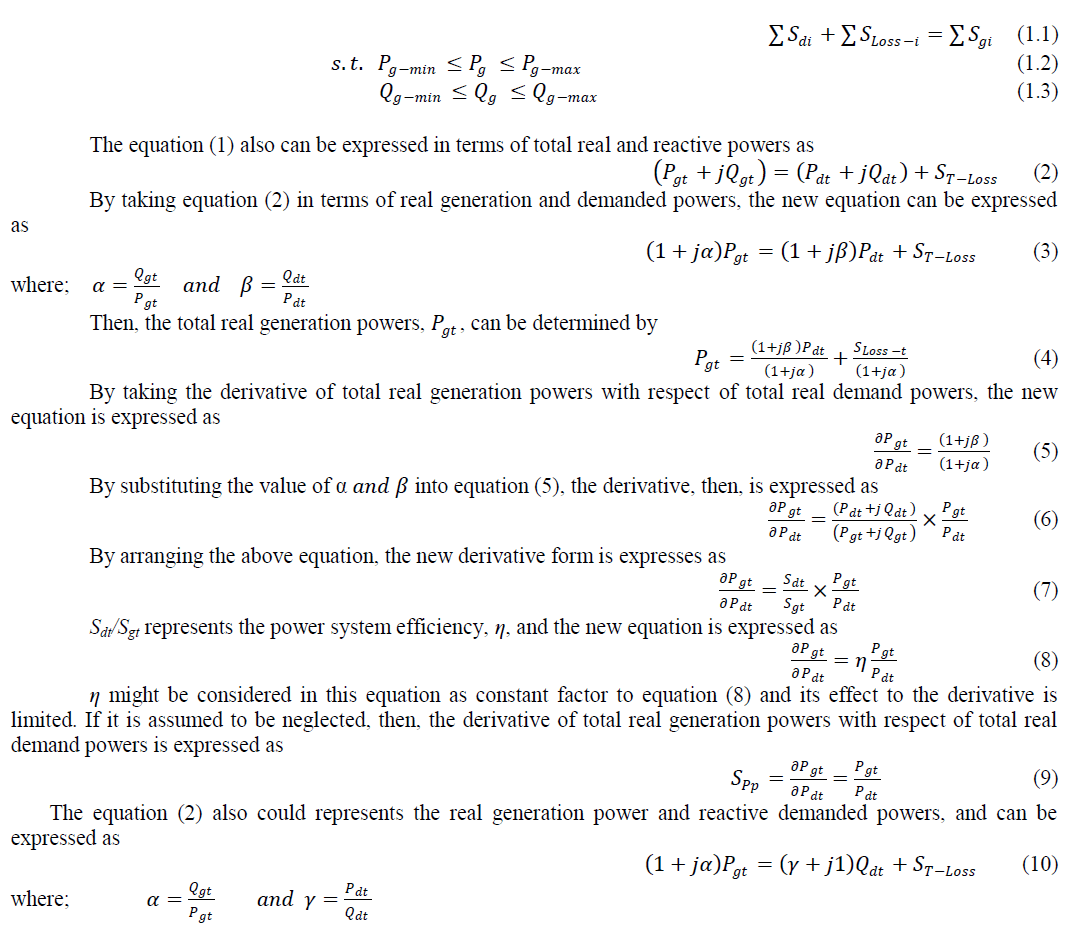
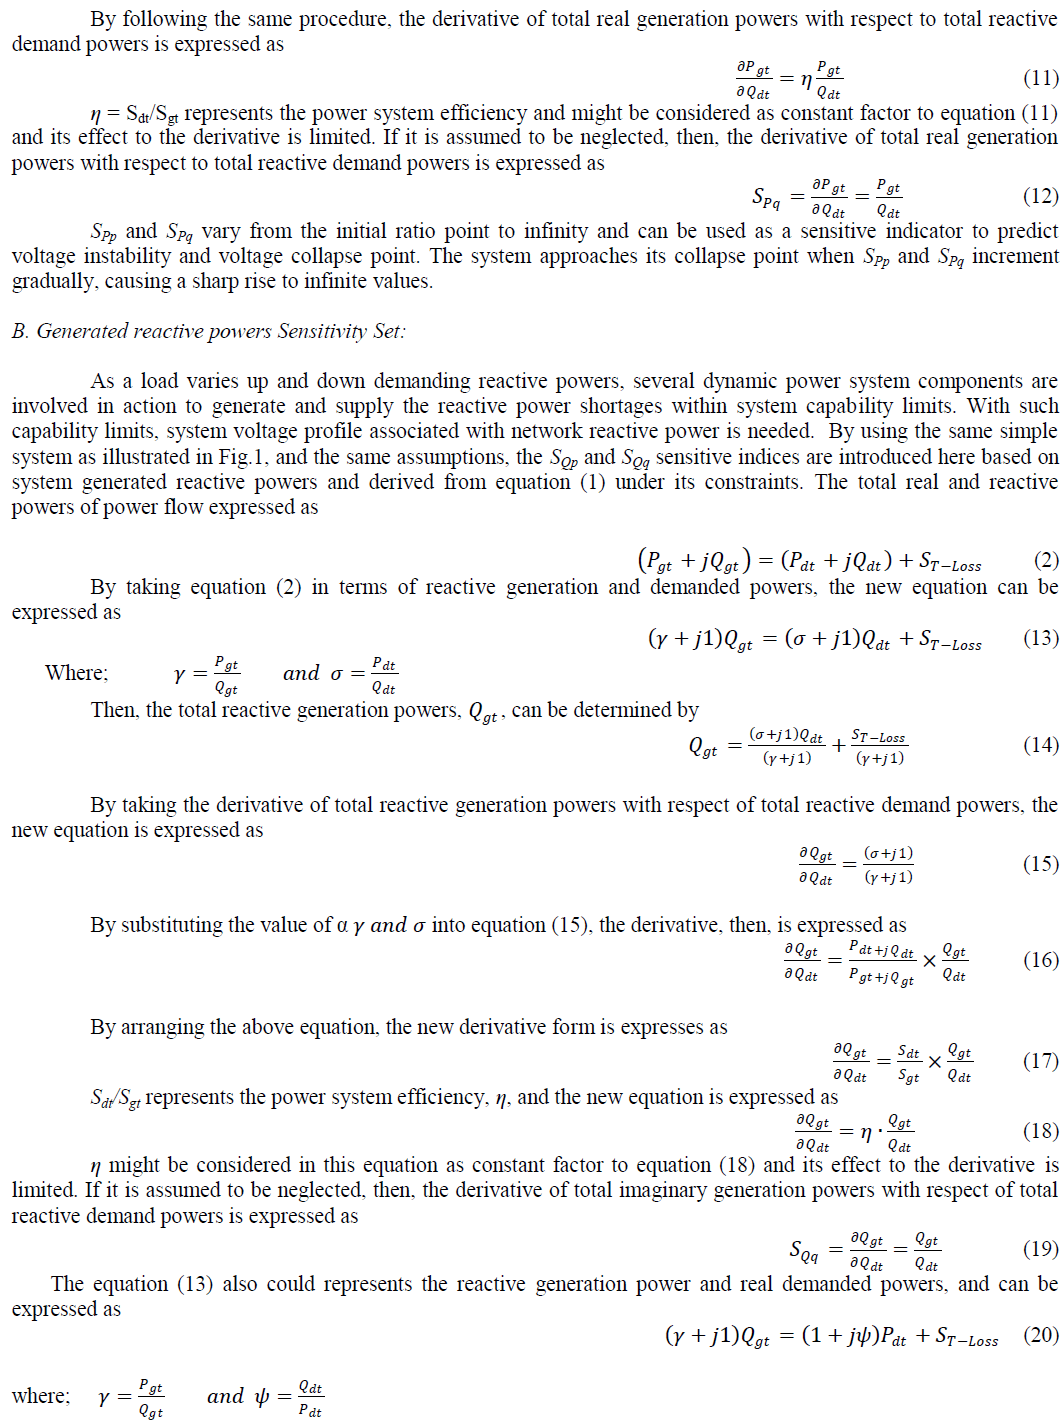
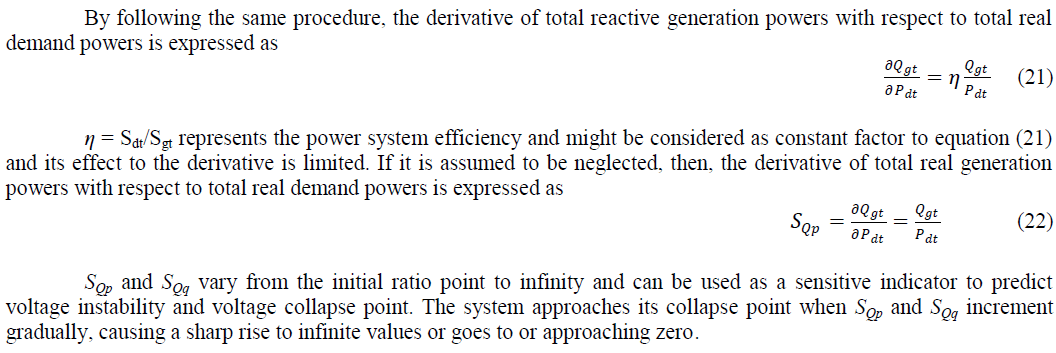
| This model can be extended to an n-bus power system. Using a generated real power as a base, the SPp and SPq sensitive indices can be derived from load flow equations with its constraints. Power system can be represented under subject constrained as following |
 |
 |
 |
REVIEW OF VOLTAGE STABILITY METHODS |
| This section briefly discusses three methods of conducting voltage stability analysis which are: modal analysis introduced in [32] and the voltage instability indices TRGG[28] and VCPI[25]. |
A Modal Analysis: |
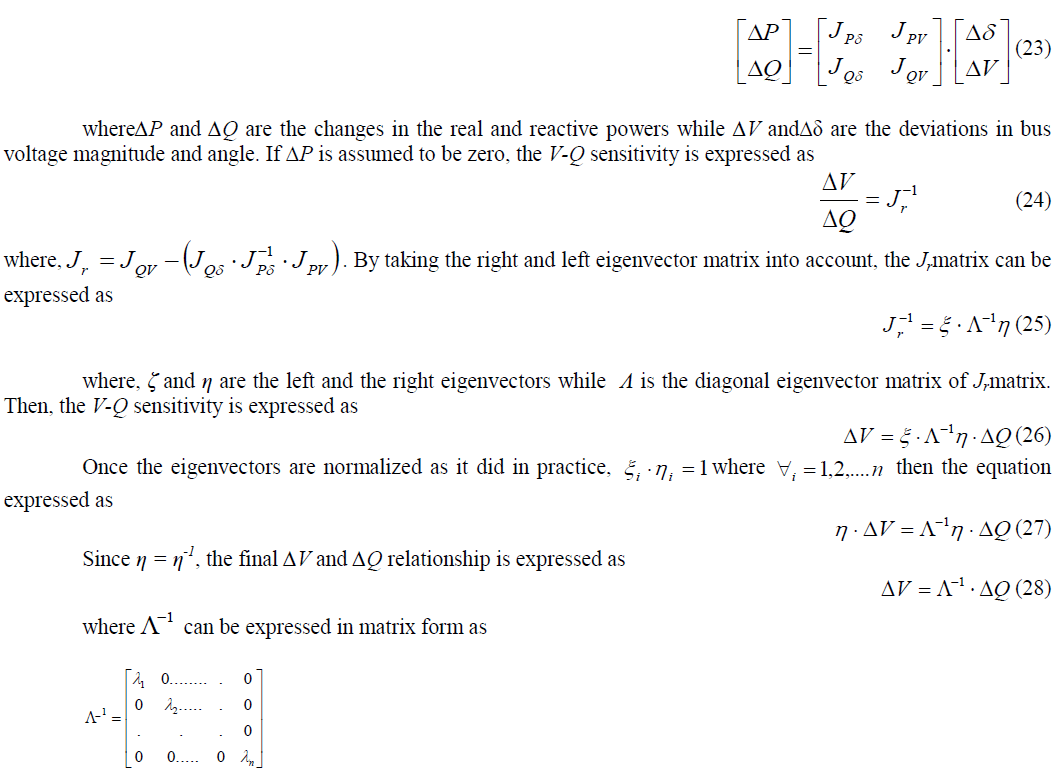
| Modal analysis is used to computes eigenvalues and eigenvectors of a reduced Jacobian matrix of power flow to predict voltage instability in power systems. The eigenvalues of the reduced matrix determine the system mode while the eigenvectors gives an approximate measure to system instability. The equation of power flow is given by |
 |
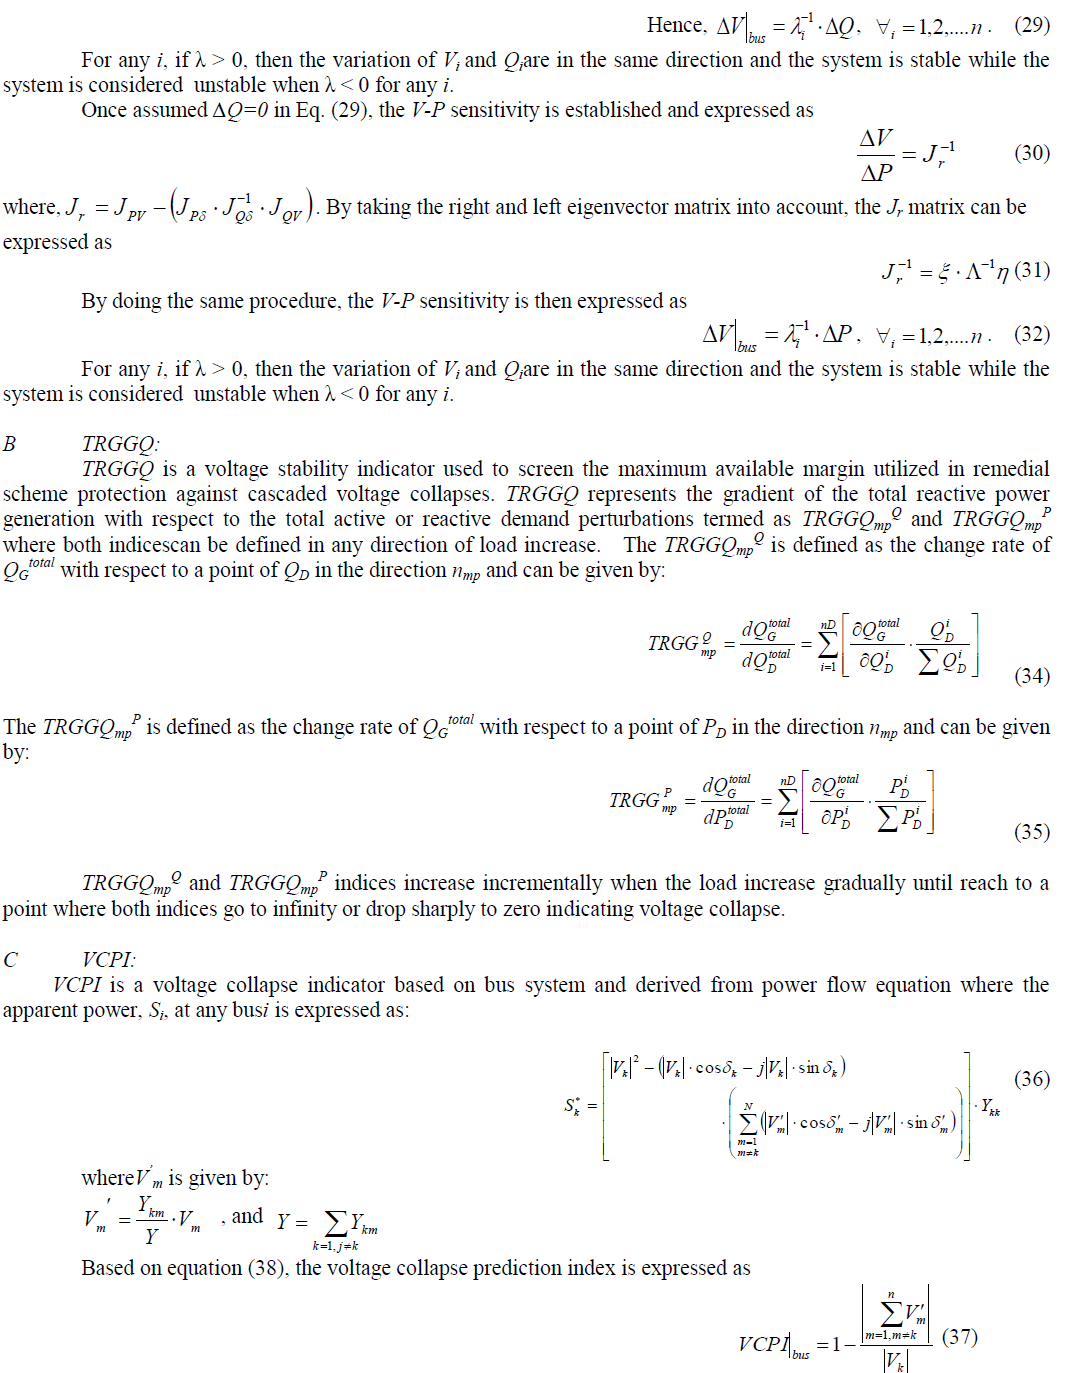 |
| VCPI varies from zero to one, indicating the voltage stability margin. Once the value of VCPI closes to unity or exceeds it, the system voltage collapses. |
RESULTS AND DISCUSSION |
| This section demonstrates an implementation of the proposed indicesSPp, SPq, SQp, andSQq on IEEE 14-bus, 57- bus and 118-bus systems to approximate how far the system is from its point of collapse based on load behaviour. Those indices were compared with modal analysis indices (dV/dP and dV/dQ),TRGG (TRGGQp and TRGGQq), and VCPIto validate their accuracy. The characteristics of these methods are different, yet they have something in common. They all share system maximum power transfer and voltage stability margin starting by system normal condition and ending by system voltage collapse. Loading scenarios were considered here to validate the accuracy of the proposed indices at which each scenario represented a gradual load increase until the system reached to voltage collapse point. |
 |
A. IEEE 14-bus system: |
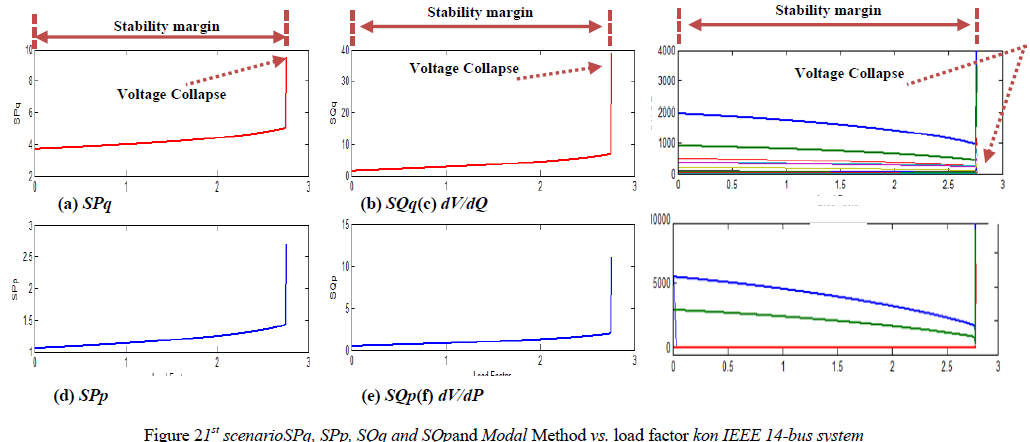
| Figures (2) and (3) show the performance of SPp, SPq, SQp, andSQqon IEEE 14-bus system and their sensitive indications were compared to the results of modal analysis indices, dV/dP and dV/dQ, to verify their accuracy of estimating the point of voltage collapse for two loading scenarios. In each of these figures, SPq, SPp, SQqandSQp, are shown in sub-figures (a), (b), (d), (e) respectively, while dV/dP and dV/dQ are shown in subfigures (c) and (f) respectively. |
| Figure 2 illustrates the first loading scenario where the loads at all bus were incrementally increased with identical loading rate k until the IEEE 14-bus system collapsed. The results showed that SPp, SPq, SQp, andSQqpredicted the point of voltage collapse at loading rate k = 2.75; as dV/dP and dV/dQ indices predicted. Voltage stability margin was also estimated by all indices starting with steady-state condition and ending by system voltage collapse. SPp, SPq, |
 |
| SQp, andSQq started at the initial system state with clear and readable voltage stability indications and increased gradually along with load increase until reached a point where they went sharply to infinity. |
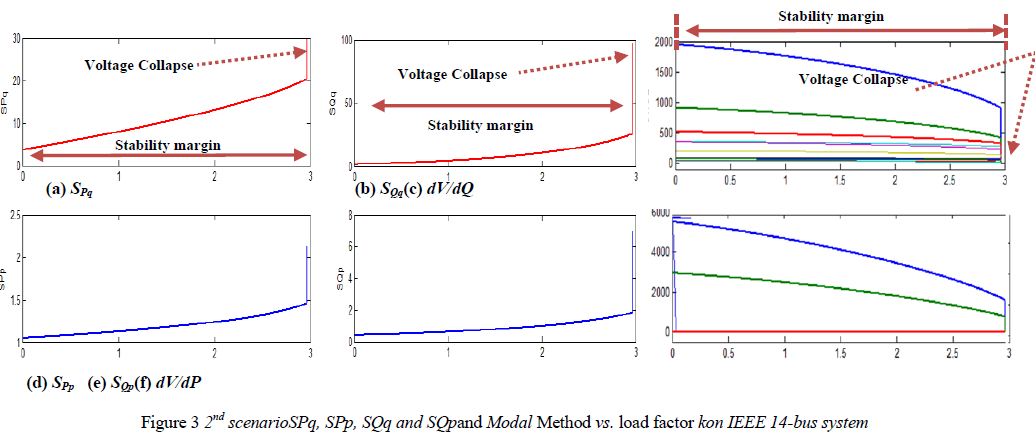
| Figure 3 is an illustration of second scenario when only the real powers at all buses were increased gradually till system collapse. All performed indices predicted accurately the point of voltage collapse at loading rate k = 2.96 sharing similar voltage stability margin. The eigenvalues of dV/dP and dV/dQ dropped from high to low values approaching to zero, where SPp, SPq, SQp, andSQq went sharply to infinity indicating system voltage collapse point. |
| dV/dP and dV/dQ in subfigures (2.c) and (2.f) approximated the sensitive measures to system voltage instability for number of system buses. The sensitivity of the generated real powers to changeable demanded (active and reactive) powers were demonstrated in subfigures (2.a) and (2.d) while SQp, andSQq illustrated in subfigures (2.b) and (2.e) showed the response of system generated reactive powers to load increase. |
 |
B. IEEE 57-bus system: |
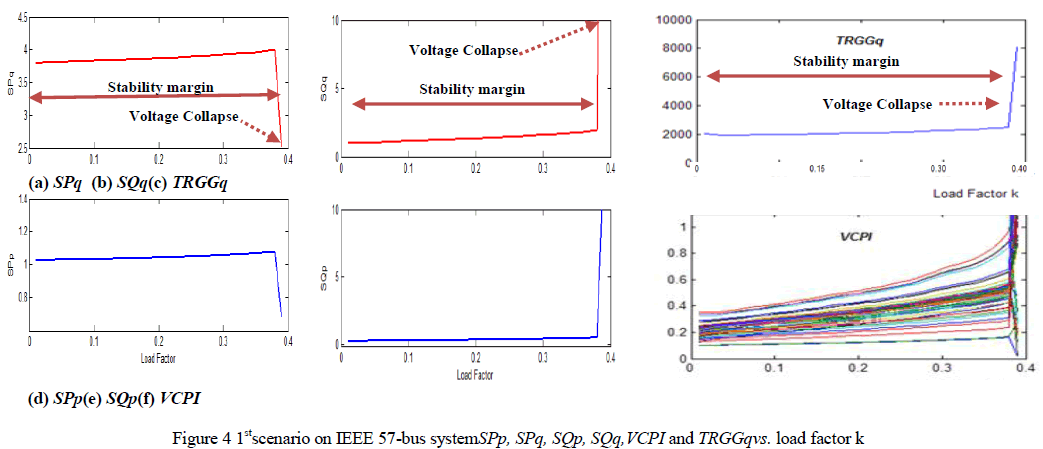
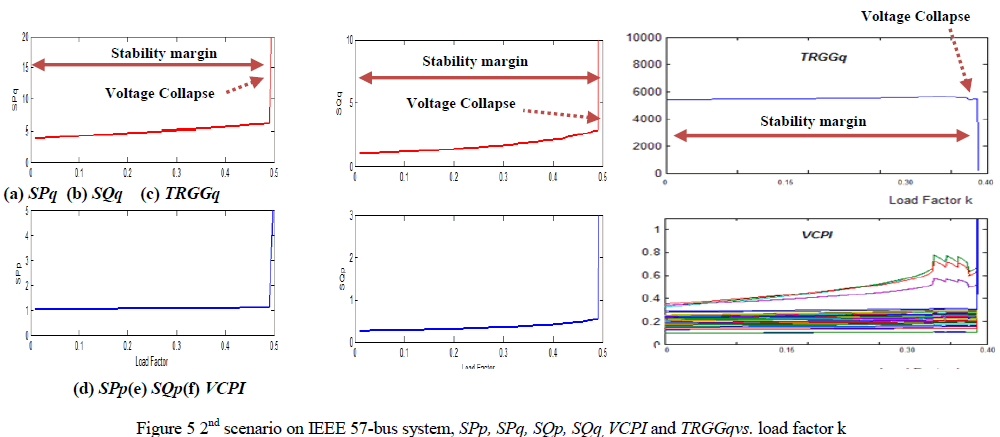
| Figures (4) and (5) show the performance of SPp, SPq, SQp, andSQqon IEEE 57-bus system. The results of performed indices were compared to alternative methodsto verify their accuracy for two loading scenarios. In each of these figures, SPp, SPq, SQp, andSQq, are shown in sub-figures (a), (b), (d), (e) respectively, while TRGGQq and VCPI are shown in subfigures (c) and (f) respectively. |
| Figure 4 represents the performance of SPp, SPq, SQp, andSQqindices for the first scenario in which the IEEE 57- bus system was subjected to load increase. All indices started with system initial state and ended at the same voltage collapse point at loading rate k =0.39, where SQp, SQq and TRGGQq went to infinity andSPp, SPqdropped sharply |
 |
| approaching zero. At the same point, VCPI exceeded its stability boundaries passing its unity approaching infinity. TheVCPI has an advantage of providing voltage stability indications at each individual bus while the proposed sensitive indices along with TRGGq have a great sensitivity to system voltage collapse based on active and reactive powers which can be used in load-generation balance. |
| The generated powers, active and reactive powers, were clearly demonstrated load-generation sensitivity in IEEE 57-bus system producing system stability indications along with load increase, estimating load-generation stability margin, and approximate the system to the point of its voltage collapse based on its load-generation sensitivity. Figure 5 illustrates the second loading scenario where the real loads only at all bus were incrementally increased with identical loading rate k until the IEEE 57-bus system collapsed. The results showed that SPp, SPq, SQp, andSQqindices accurately projected the point of voltage collapse at loading ratek = 0.49 while TRGGq and VCPI predicted system collapse earlier by 0.02 loading rate kdifference. At the point of system collapse, TRGGq went sharply to zero and VCPI passed its stability limits whileSPp, SPq, SQp, andSQqindices approached infinity. |
| The proposed indices responded instantly to any load change indicating how the system regains its loadgeneration equilibrium. SPp,andSQpexpress a direct sensitivity to load active power increase while SPqand SQqindicate the system impact to any increase of load reactive powers. |
 |
C. IEEE 118-bus system: |
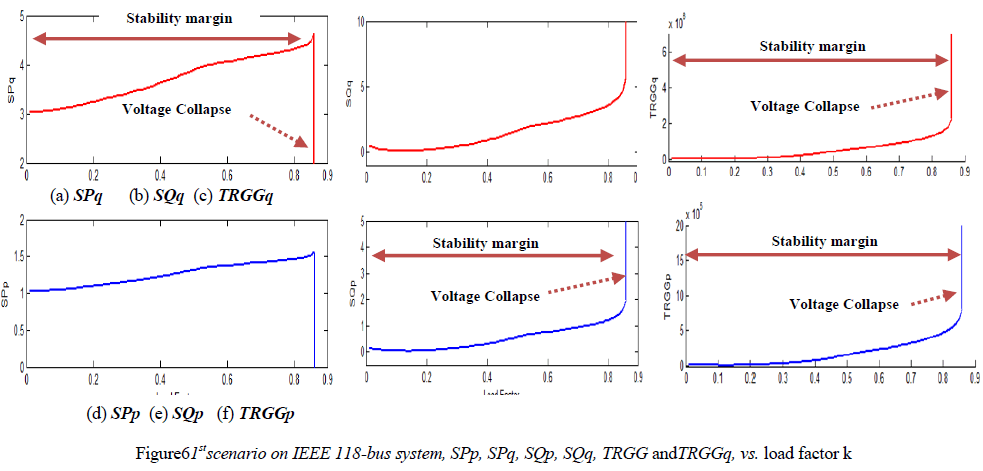
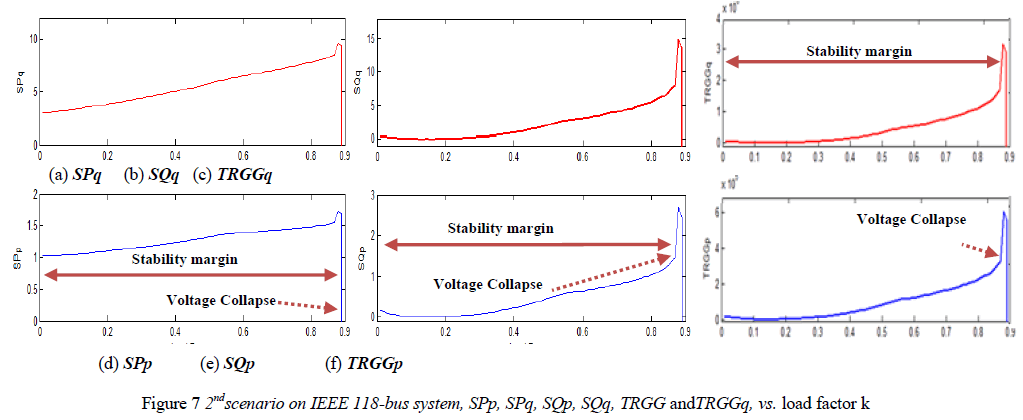
| The proposed indices are also implemented in large IEEE 118-bus system to check their performance in large power systems. Figures (6) and (7) illustrate their performance for two scenarios comparing their results with TRGGQp and TRGGQqas an alternative method. In each of these figures, SPq, SQq, SPpandSQp are shown in sub-figures (a), (b), (d), (e) respectively, while TRGGq and TRGGQp are shown in subfigures (c) and (f) respectively. |
 |
| At figure 6, the results showed that SPq, SQq, SPpandSQp accurately projected the point of voltage collapse as TRGGp and TRGGq did at loading rate k = 0.86. At this point, all compared indices increased gradually along with load increase reaching a point where all indices went sharply to infinity except SPpandSPqdropped severely to zero. Between initial state and collapse pint, all indices shared an identical voltage stability margin. |
| At a second scenario shown in figure 7 where IEEE 118-bus system was subjected only to real load increase, all indices collapsed at the same voltage collapse point at loading rate k =0.89, where all indices rose with load increase to higher values depending their sensitive characteristics and then dropped sharply approaching zero. Voltage stability margins also estimated equally by SPq, SQq, SPpandSQp accuratelyindices and verified with TRGGpandTRGGqindices measuring how far the system is from its collapse. Here, the SPqandSQp reacted sensitively as real load was changeed with clear and readable indications while SPqandSQqmeasured system sensitivity to any demanded reactive powers. This describes clearly the dynamics of power transfer through the transmission systems and how the system responses to load changes. |
D. Indices Computation time on IEEE 118-bus system: |
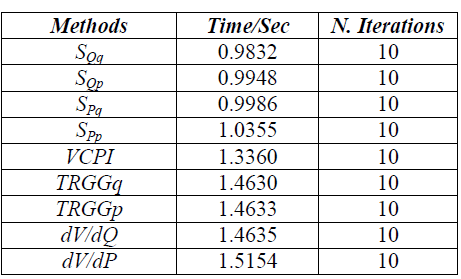
| Low computation time in voltage stability analysis is considerably critical, because some power systems operate daily perhaps hourly near to transmission capability limits. Conducting a fast voltage stability analysis is a significant factor to prevent such system instability. Thus, SPq, SQq, SPpandSQp indices were demonstrated their speediness in voltage stability analysis on IEEE 118-bus system compared to alternative methods as shown in Table.1. The results showed that the proposed indices had the highest speed records in conducting voltage stability analysis recording 0.9832sec, 0.9948 sec, 0.9986sec, and 1.0355sec for SQq, SQp, SPq, andSPprespectivelywhile Modal indices recorded the highest computation time estimated at 1.4635sec and 1.5154sec for dV/dQ and dV/dP respectively. A successful avoidance of voltage collapse is based on method accuracy with low computation time. |
| TABLE1: |
| A Computation Time Comparison amongMethods Implemented in IEEE 118-Bus System |
 |
E. Overall Results: |
| The overall results show thatSPq, SQq, SPpandSQpindices accurately predicted voltage collapse point as the alternative methods did showing that they all shared similar voltage stability margin. Our results also show that the proposed indices had the lowest computation time recording 0.9832sec. to1.3360sec. |
| VCPI, TRGG, and modal analysis are voltage stability analyses; where VCPI is a ratio between the sendingreceiving voltages, and TRGGQ calculates the system distance to voltage collapse based on load power components, while Modal analysis, dV/dP and dV/dQ, computes the eigenvalues and eigenvectors as to provide a proximity measures to Jacobian matrix singularity. Despite the fact that both proposed and alternative methods have different characteristics, they all share system maximum power transfer and voltage stability margin. |
| However, although modal analysis and TRGGQ are powerful voltage stability analysis, they are complex consuming high computational time. It is unnecessarily to compute the minimum eigenvalues and system mode for a large power system with thousands of busses attempting to extract voltage stability at each individual bus or system line while voltage collapse sensitivity for the system as a whole is not enough to prevent voltage collapse. |
| VCPI is simple voltage stability analysis with low computational time, yet its index relays on the ratio between the sending and receiving voltages which may fail to detect accurate indications near P-V buses with no sing of remedial actions. |
| SPq, SQq, SPpandSQpare the gradient of generated powers with respect to load components producing sensitive voltage stability indications. The SPqandSQp response sensitively when real load power changes with clear and readable indications while SPqandSQqmeasured system sensitivity to any demanded reactive power changes. This describes clearly the dynamics of power transfer through the transmission systems and how the system responses to load changes indicating how the system regain its load-generation equilibrium when load rate changes. SPq, SQq, SPpandSQpaccurately project the point of voltage collapse as the alternative method predicted measuring system sensitivity margin to system collapse. |
| Thus, the proposed indices,SPq, SQq, SPpandSQpare superior in their simplicity, accuracy, and speed calculations indicating powerful tools to approximate power system to its collapse point. With such simplicity, accuracy and speeds of data readability operators may act faster than before particularly when the system subjected to a sudden disturbance. |
CONCLUSION |
| This paper presents a new approach of voltage stability analysis projecting successfully the point of voltage collapse. Four sensitive indices were proposed: SPpandSQpresponse sensitively when real load power changes with clear and readable indications while SPqandSQqmeasured system sensitivity to any demanded reactive power changes. SPq, SQq, SPpandSQpgenerate sensitive indications to voltage collapse for any load change indicating how far the system is from its collapse point. |
| The prosed indices accurately projected the point of voltage collapse as the alternative method predicted measuring system sensitivity margin to system collapse and indicatinghow the system regain its load-generation equilibrium when load rate changes. The results also showed that the system capability of compensating the reactive power demands was indicated by SPqand SQq while SPpandSQp reflect the system capability of supplying real power demands. Our results also showed that the proposed indices had the lowest computation timecomparing to alternatives. |
| The proposed indices,SPq, SQq, SPpandSQpare superior in their simplicity, accuracy, and speed calculations indicating powerful tools to approximate power system to its collapse point. With such simplicity, accuracy and speeds of data readabilityoperators may act faster than before particularly when the system subjected to a sudden disturbance |
References |
|