ISSN ONLINE(2319-8753)PRINT(2347-6710)
ISSN ONLINE(2319-8753)PRINT(2347-6710)
| Dr. H.N. Khare1 and Dr. Sandeep K. Shukla2 |
| Related article at Pubmed, Scholar Google |
Visit for more related articles at International Journal of Innovative Research in Science, Engineering and Technology
In the present study water quality status of Benisagar dam in Chhatarpur district (M.P.) India were determined during June 2012 to May 2013. Benisagar dam is situated with Longitudes and Latitudes of 24o6’ and 25o20’ on North 78o59’ to 80o26’ on East respectively with approximate182 meter above mean sea level experiencing an annual rain fall of 975-1150 m.m. Average temperature in cold 6-9 oC, summer 45-47o C, and rain 28-37oC. Banisagar dam is the most important dam of Chhatarpur district; besides being a source of water for irrigation and also the water of this dam used for artificial breading of Major Carp in the Chinese Hatchery is located here and area of the dam 380 hectare. The monthly intervals during June 2012 through May 2013 with an objective to estimate the water quality of the dam on various physico-chemical parameters Total solids, total suspended solids, total solids, turbidity and sulphate values were maximum on all the sites in rainy months, which may be due to the gradual disturbances in sedimentation of solids as well as dust particles deposited along with runoff rainwater. The alkalinity varied during different months. The values of pH, conductivity, hardness, dissolved oxygen C.O.D. and biological oxygen demand were higher during summer months. The chloride concentration was highest in the month of January and the nitrate increased in the summer months.
Keywords |
| Benisagar Dam, water quality deterioration. |
I. INTRODUCTION |
| Aquatic ecosystem is the most diverse ecosystem in the world. The first life originated in the water and first organisms were also aquatic where water was the principal external as well as internal medium for organism. Reservoirs are formed or modified by human activity for specific purposes, in order to provide a reliable and controllable resource. Reservoirs are usually found in areas of water scarcity or excess, or where there are agricultural or technological reasons to have controlled water resources (Wetzel, 1995). |
| Expanding human population brought about by the opportunities of good water supply, irrigation, fish production recreation and navigation offered by Dam has put enormous pressure and stress on the quality of water impounded by the dam. The impact of human activities in and around the dam is felt on the unique physical and chemical properties of water on which the sustenance of fish that inhabit the reservoir is built as well as to the functions of the reservoir. Water quality is determined by the physical and chemical limnology of a reservoir (Sidnei et al., 1992) and includes all physical, chemical and biological factors of water that influence the beneficial use of the water. Water quality is important in drinking water supply, irrigation, fish production, recreation and other purposes to which the water must have been impounded. |
| Water quality deterioration in reservoirs usually comes from excessive nutrient inputs, eutrophication, acidification, heavy metal contamination, organic pollution and obnoxious fishing practices. The effects of these “imports” into the dam do not only affect the socio-economic functions of the dam negatively, but also bring loss of structural biodiversity of the reservoir. Djukic et al. (1994) have used the physico-chemical properties of water to assess the water quality of a dam. The use of the physico-chemical properties of water to assess water quality gives a good impression of the status, productivity and sustainability of such water body. The changes in physical characteristics like temperature, transparency and chemical elements of water such as dissolved oxygen, chemical oxygen demand, nitrate and phosphate provide valuable information on the quality of the water, the source of the variations and their impacts on the functions and biodiversity of the dam. |
| This study aimed at assessing the water quality of Benisagar dam for drinking and fish production using some selected physico-chemical properties. The results will form the baseline for monitoring and tracking changes in the water quality as a result of the dams natural dynamics over time or impact of human activities on the dam. |
II. DESCRIPTION OF THE STUDY SITE |
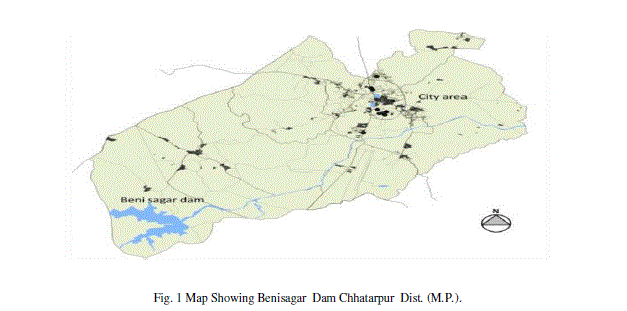
| Benisagar dam is situated with Longitudes and Latitudes of 24o6’ and 25o20’ on North 78o59’ to 80o26’ on East respectively with approximate182 meter above mean sea level experiencing an annual rain fall of 975-1150 m.m. Average temperature in cold 6-9 oC, summer 46-48o C, and rain 28-37oC. Banisagar dam is the most important dam of Chhatarpur district; besides being a source of water for irrigation and also the water of this dam used for artificial breading of Major Carp in the Chinese Hatchery is located here and area of the dam 380 hectare (Fig.-1). The Dam is anthropogenic and Dam water is used for domestic purpose, irrigation, aquaculture etc. The surrounding area of dam is rural and agricultural. The need to define quality of water has development with the increasing demand of water, which is suitable for specific uses and confirms to desired quality. |
 |
III. MATERIAL AND METHODS |
| Samples were collected monthly from five different sampling stations namely A, B, C, D, and E for one year (June 2012 to May 2013). The samples were collected at 9 am -1pm during first week of each month. Some of the physicochemical characteristics of water were analysed at the spot such as water temperature, colour, transparency, pH which were determined by thermometer, visual sechi disc, and digital pH meter respectively. While, others like D.O., Total alkalinity, contents were analyzed by titric method in laboratory and other parameters like turbidity, conductivity, TDS, Nitrate, Phosphate, BOD and COD were analysed within 24 hrs. as per the procedure given in APHA (1995) , and Trivedy and Goel(1986). |
IV. RESULTS AND DISCUSSION |
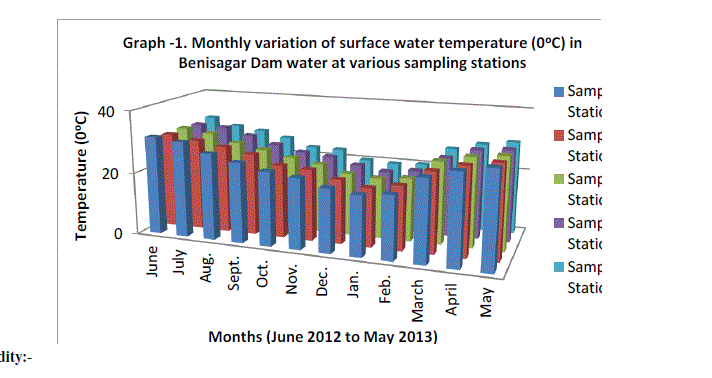
| The mean monthly variation in the surface water temperature of the five sampling stations is presented in Graph no.1. The temperature ranged between the lowest values of 19.4±0.25°C obtained from mean values of five sampling Station in January 2012 and the highest of 29.56±0.21°C obtained from mean values of five sampling Station May, 2012. Dry season temperature was not significantly higher (P=1) than the wet season. No significant difference was seen among the sampling station and in one year. This type of observation for shallow water bodies is in conformity with the earlier findings (Malhotra et al., 1986). |
 |
| Turbidity:- |
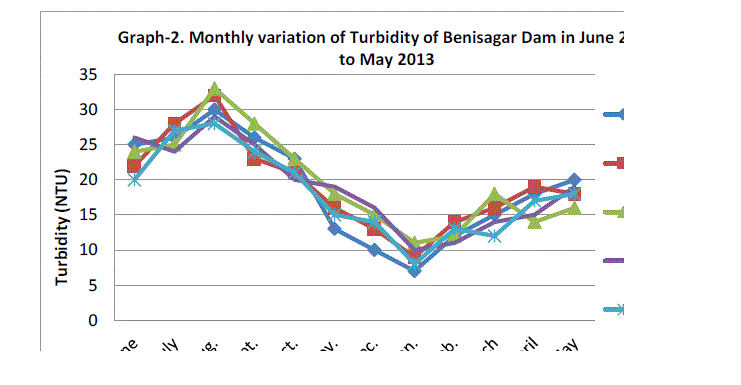
| Water turbidity fluctuated between the lowest monthly mean of sampling station 9.00±1.58 NTU obtained in January 2012 and the highest monthly mean of sampling station 30.40±2.07 NTU recorded in August 2012 from (Graph 2). Statistical difference at P=0.912 was noticed in the turbidity concentration among the stations. Higher turbidity affects the life indirectly as its cut of light to be utilized by plants for photosynthesis there by lowering the rate of primary productivity and Verma et al.(2012) Thus our results are supported by previous workers. |
 |
| Transparency:- |
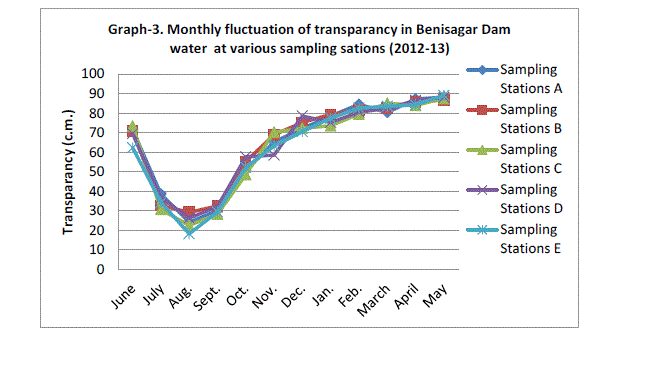
| Secchi disc transparency was the highest mean value of sampling station 88.20±0.67 c.m obtained in May 2013 and lowest mean value recorded 24.06±4.13 c.m. in August of 2012 (Graph 3). During the dry season year 2012 not significantly higher transparency (p=0.945). The high values of transparency observed during the period of November to March may be attributed to the low plankton population. The transparency of water is affected in various seasons due to algal blooms and suspended sediments (Horn and Goldman, 1994). |
 |
| pH |
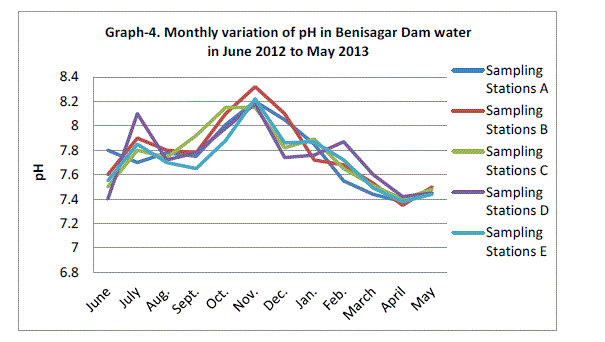
| The Hydrogen ion concentration fluctuated between the lowest monthly mean of sampling sites 7.39±0.03 mg/L obtained in April 2013 and the highest monthly mean of sampling sites 8.21±0.06 mg/L recorded in November 2012 from (Graph 4). There was no significant difference in the concentration of hydrogen ions between sampling site and months of year (p=0.082). Similar results were observed in Lake Pandu Bodhan, Andhra Pradesh State, India by Solanki V.R., Hussain M.M. and Raja S.S. (2009). |
| Alkalinity:- |
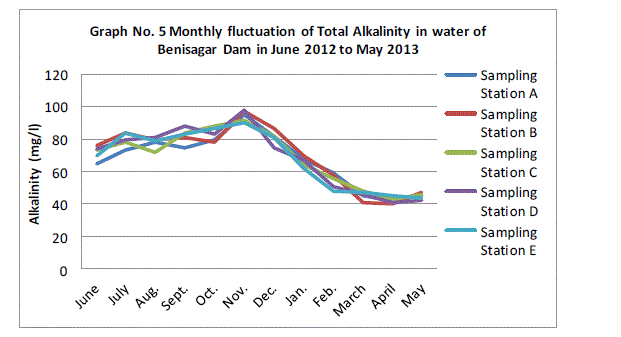
| The total alkalinity fluctuated between the lowest monthly mean of sampling station 42.20±1.92 mg/l obtained in November 2012 and the highest monthly mean of sampling stations 94.40±3.36 mg/L recorded in April 2013 from (Graph 5). Total alkalinity showed there is a not significant difference between sampling sites (p=0.87). The total alkalinity of water is usually by the carbonates, bicarbonates, hydroxyl, iron and less frequency by Borates, silicates and phosphate (APHA 1985). The pattern of fluctuation was similar in all the above studies with the results obtained in the present study. |
| Dissolved Oxygen |
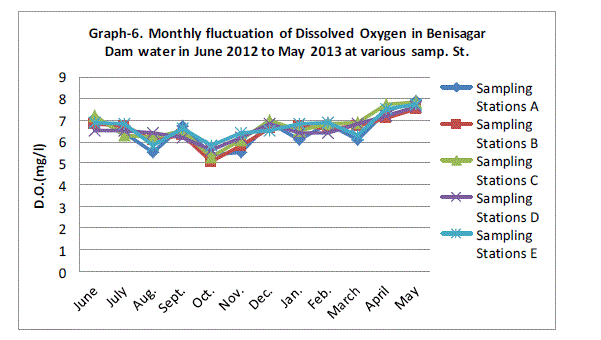
| Dissolved oxygen fluctuated between the lowest monthly mean of sampling stations 5.44±0.27 mg/L obtained in October 2011 and the highest monthly mean of sampling stations 7.70±0.16 mg/L recorded in May 2013 from (Graph 6). Statistical difference at P = 0.0001 was noticed in the dissolved oxygen concentration among the stations significant difference. Present observations are also in agreement with the findings of Kannan and Job (1979), Moundiotiya et al (2004), Rani et al (2004), Thakur and Bais (2006), Mishra et al (2008), Sharma and Capoor (2010) and Arya et al (2011). |
 |
| Chemical Oxygen Demand |
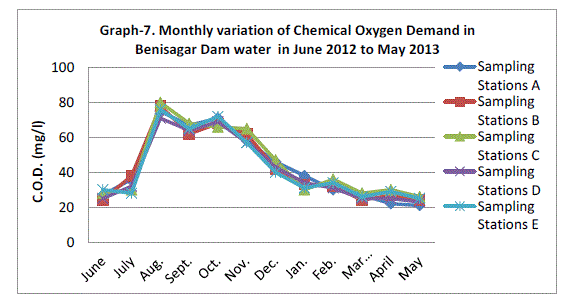
| Chemical oxygen demand (COD) varied between 23.80±1.92 mg/l and 76.00±3.39 mg/l COD was not significantly (p=0.89) higher in the rainy season with mean of Sampling Station recording (Graph 7). There was no statistical difference in COD between the one year of study. APHA (1995), however, recommended COD levels of <2 mg/L in drinking water. High COD has been linked with pollution (Tepe et al., 2005). |
| Nitrate:- |
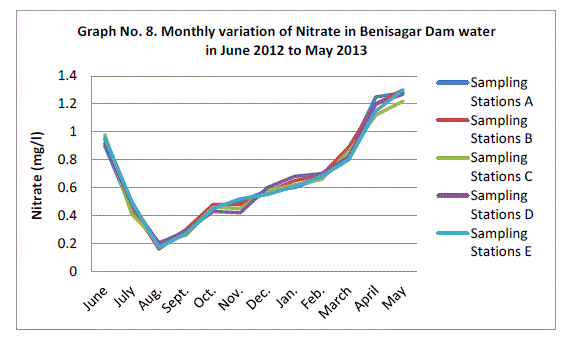
| The highest monthly mean concentration of nitrate recorded was 1.27±0.03 mg/l which was obtained from mean of sampling stations at the peak of the hot seasons May 2013. A decrease was observed in the rainy season with the lowest concentration of 0.18±0.02 mg/l recorded from mean of sampling station in August 2012 (Graph 8). ANOVA at P<0.0001 shows significant difference in the nitrate concentration during the seasons and within the stations. Therefore the present result agree with the view of Gosh et al. (1992); Trivedi and Goel (1986) and Bhatt et al (1999) have also reported the occurrence of N2 of water with high temperature, as is established in present study. |
 |
| Phosphate:- |
| The highest monthly mean concentration of phosphate recorded was 1.25±0.03 mg/l which was obtained from mean of sampling stations at the peak of the after rainy seasons and decrease was observed in the rainy season with the lowest concentration of 0.15±0.03 mg/l recorded from mean of sampling station in April 2013 (Graph 9). ANOVA at P=0.24 shows no significant difference in the phosphate concentration during the seasons and within the stations. The higher concentration of was due to inflow of domestic waste, washing and bathing as there is scarcity of water in Dam. Similar results have also been reported by Verma et al (2012) in Lake of Ahmedabad. |
| Sulphate |
| The highest monthly mean concentration of sulphate recorded was 34.80±1.92 mg/l which was obtained from mean of sampling stations at the peak of the rainy seasons July 2012. A decrease was observed in the rainy season with the lowest concentration of 11.40±2.30 mg/l recorded from mean of sampling station in April 2013 (Graph 10). ANOVA at (p<0.0001) shows significant difference in the sulphate concentration during the seasons and within the stations. Govindan and Sudarsan (1979) reported sulphate range of 30 mg/l to 127 mg/l in polluted zones of Adyar River. |
 |
 |
| Biological Oxygen Demand |
| The highest monthly mean concentration of B.O.D. recorded was 11.84±0.30 mg/l which was obtained from mean of sampling stations at the peak of the August 2012 rainy seasons and decrease was observed in the rainy season with the lowest concentration of 4.44±0.30 mg/l recorded from mean of sampling station in April 2013 (Graph 11). ANOVA at P<0.0001 shows significant difference in the B.O.D. concentration during the seasons and within the stations. These findings are also in accordance with Ahmad (1989), Parashshar et al (2008), Sharma and Capoor (2010) and Arya et al (2011). The heavy human settlements around the pond are responsible for adding municipal waste water thus creating organic pollution in the pond. It is also an important factor in enhancing the BOD value Sharma and Gupta ( 2004). |
 |
V. CONCLUSION |
| It is concluded from the present investigation that the quality of the Benisagar dam water system is continuously degrading. The source of water pollution in this dam, municipal, domestic and agricultural wastes. Various physical and chemical parameters like temperature, pH, total alkalinity, D.O, C.O.D, and B.O.D. have been observed to either approach or to have exceeded the permissible limits set for drinking water or for human use. |
ACKNOWEDGEMENT |
| Authors are highly thankful to Dr. Devendra N.Pandey, Prof., Govt. S.K.N.(P.G.) College, Mauganj Rewa (M.P.) and for completion of this work. |
References |
|